Free printable: the norms tables, scoring formulas, cut-off scores and a log for your own squad's averages on two A4 pages.
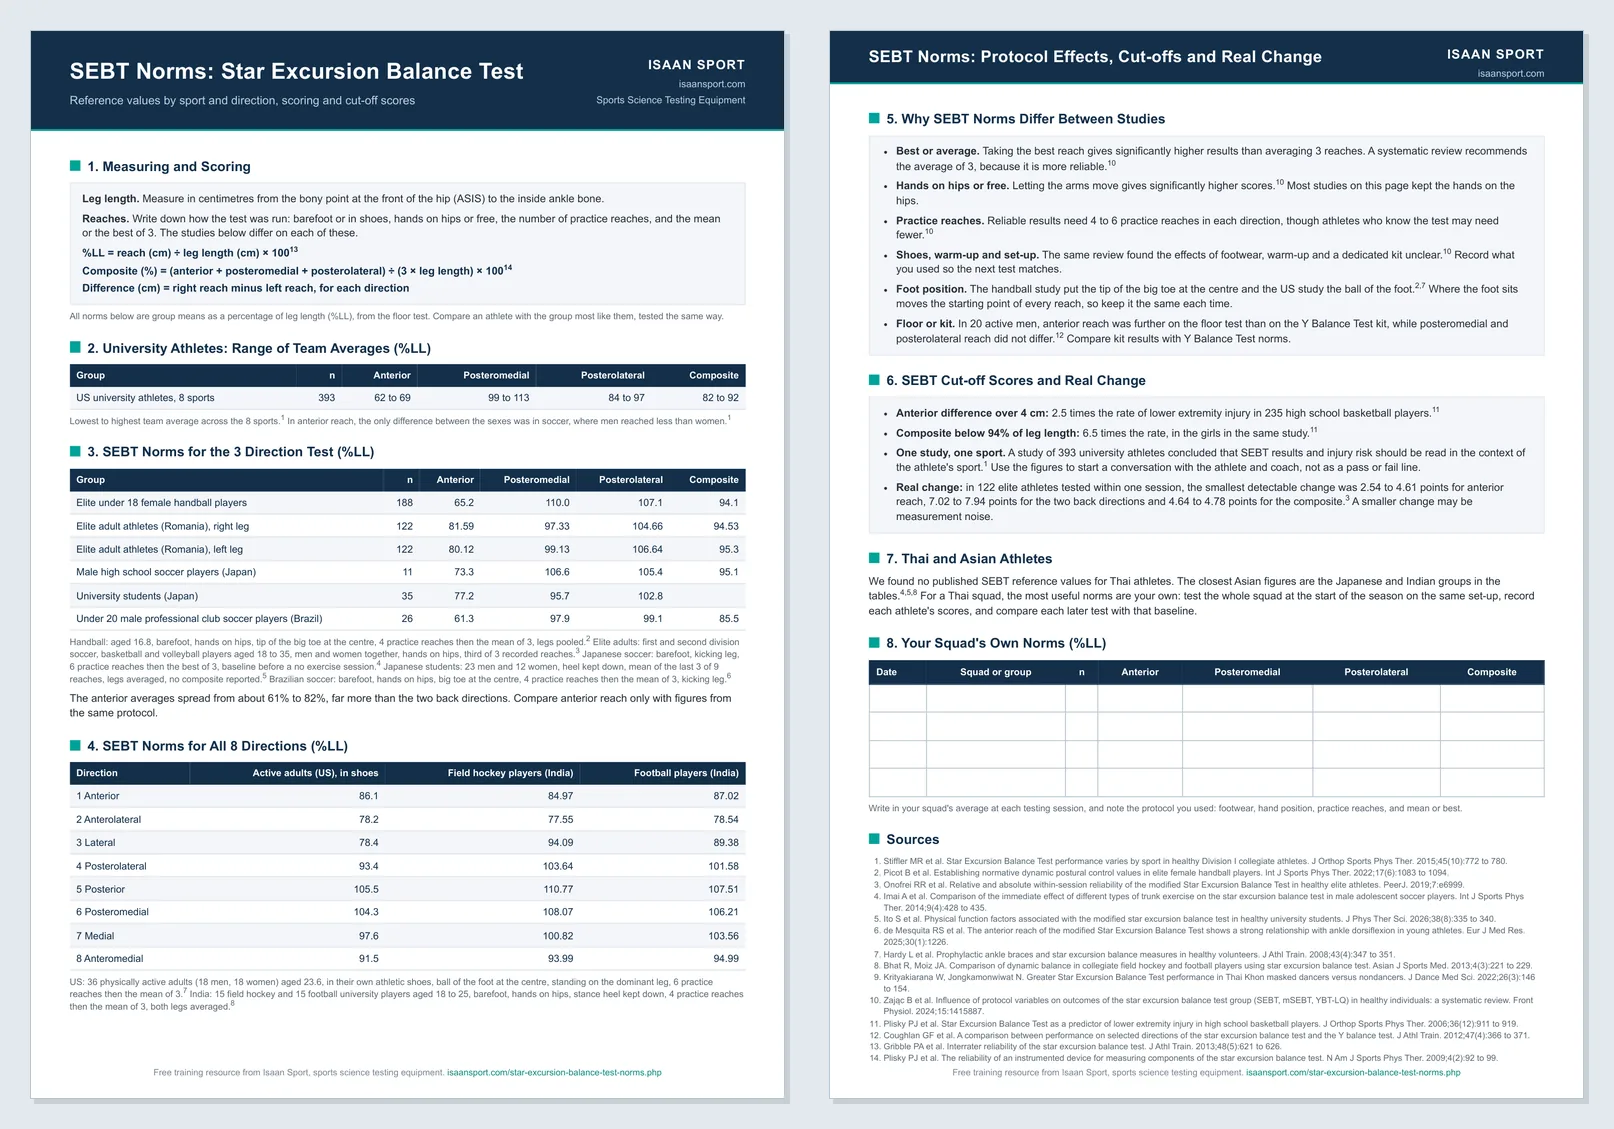
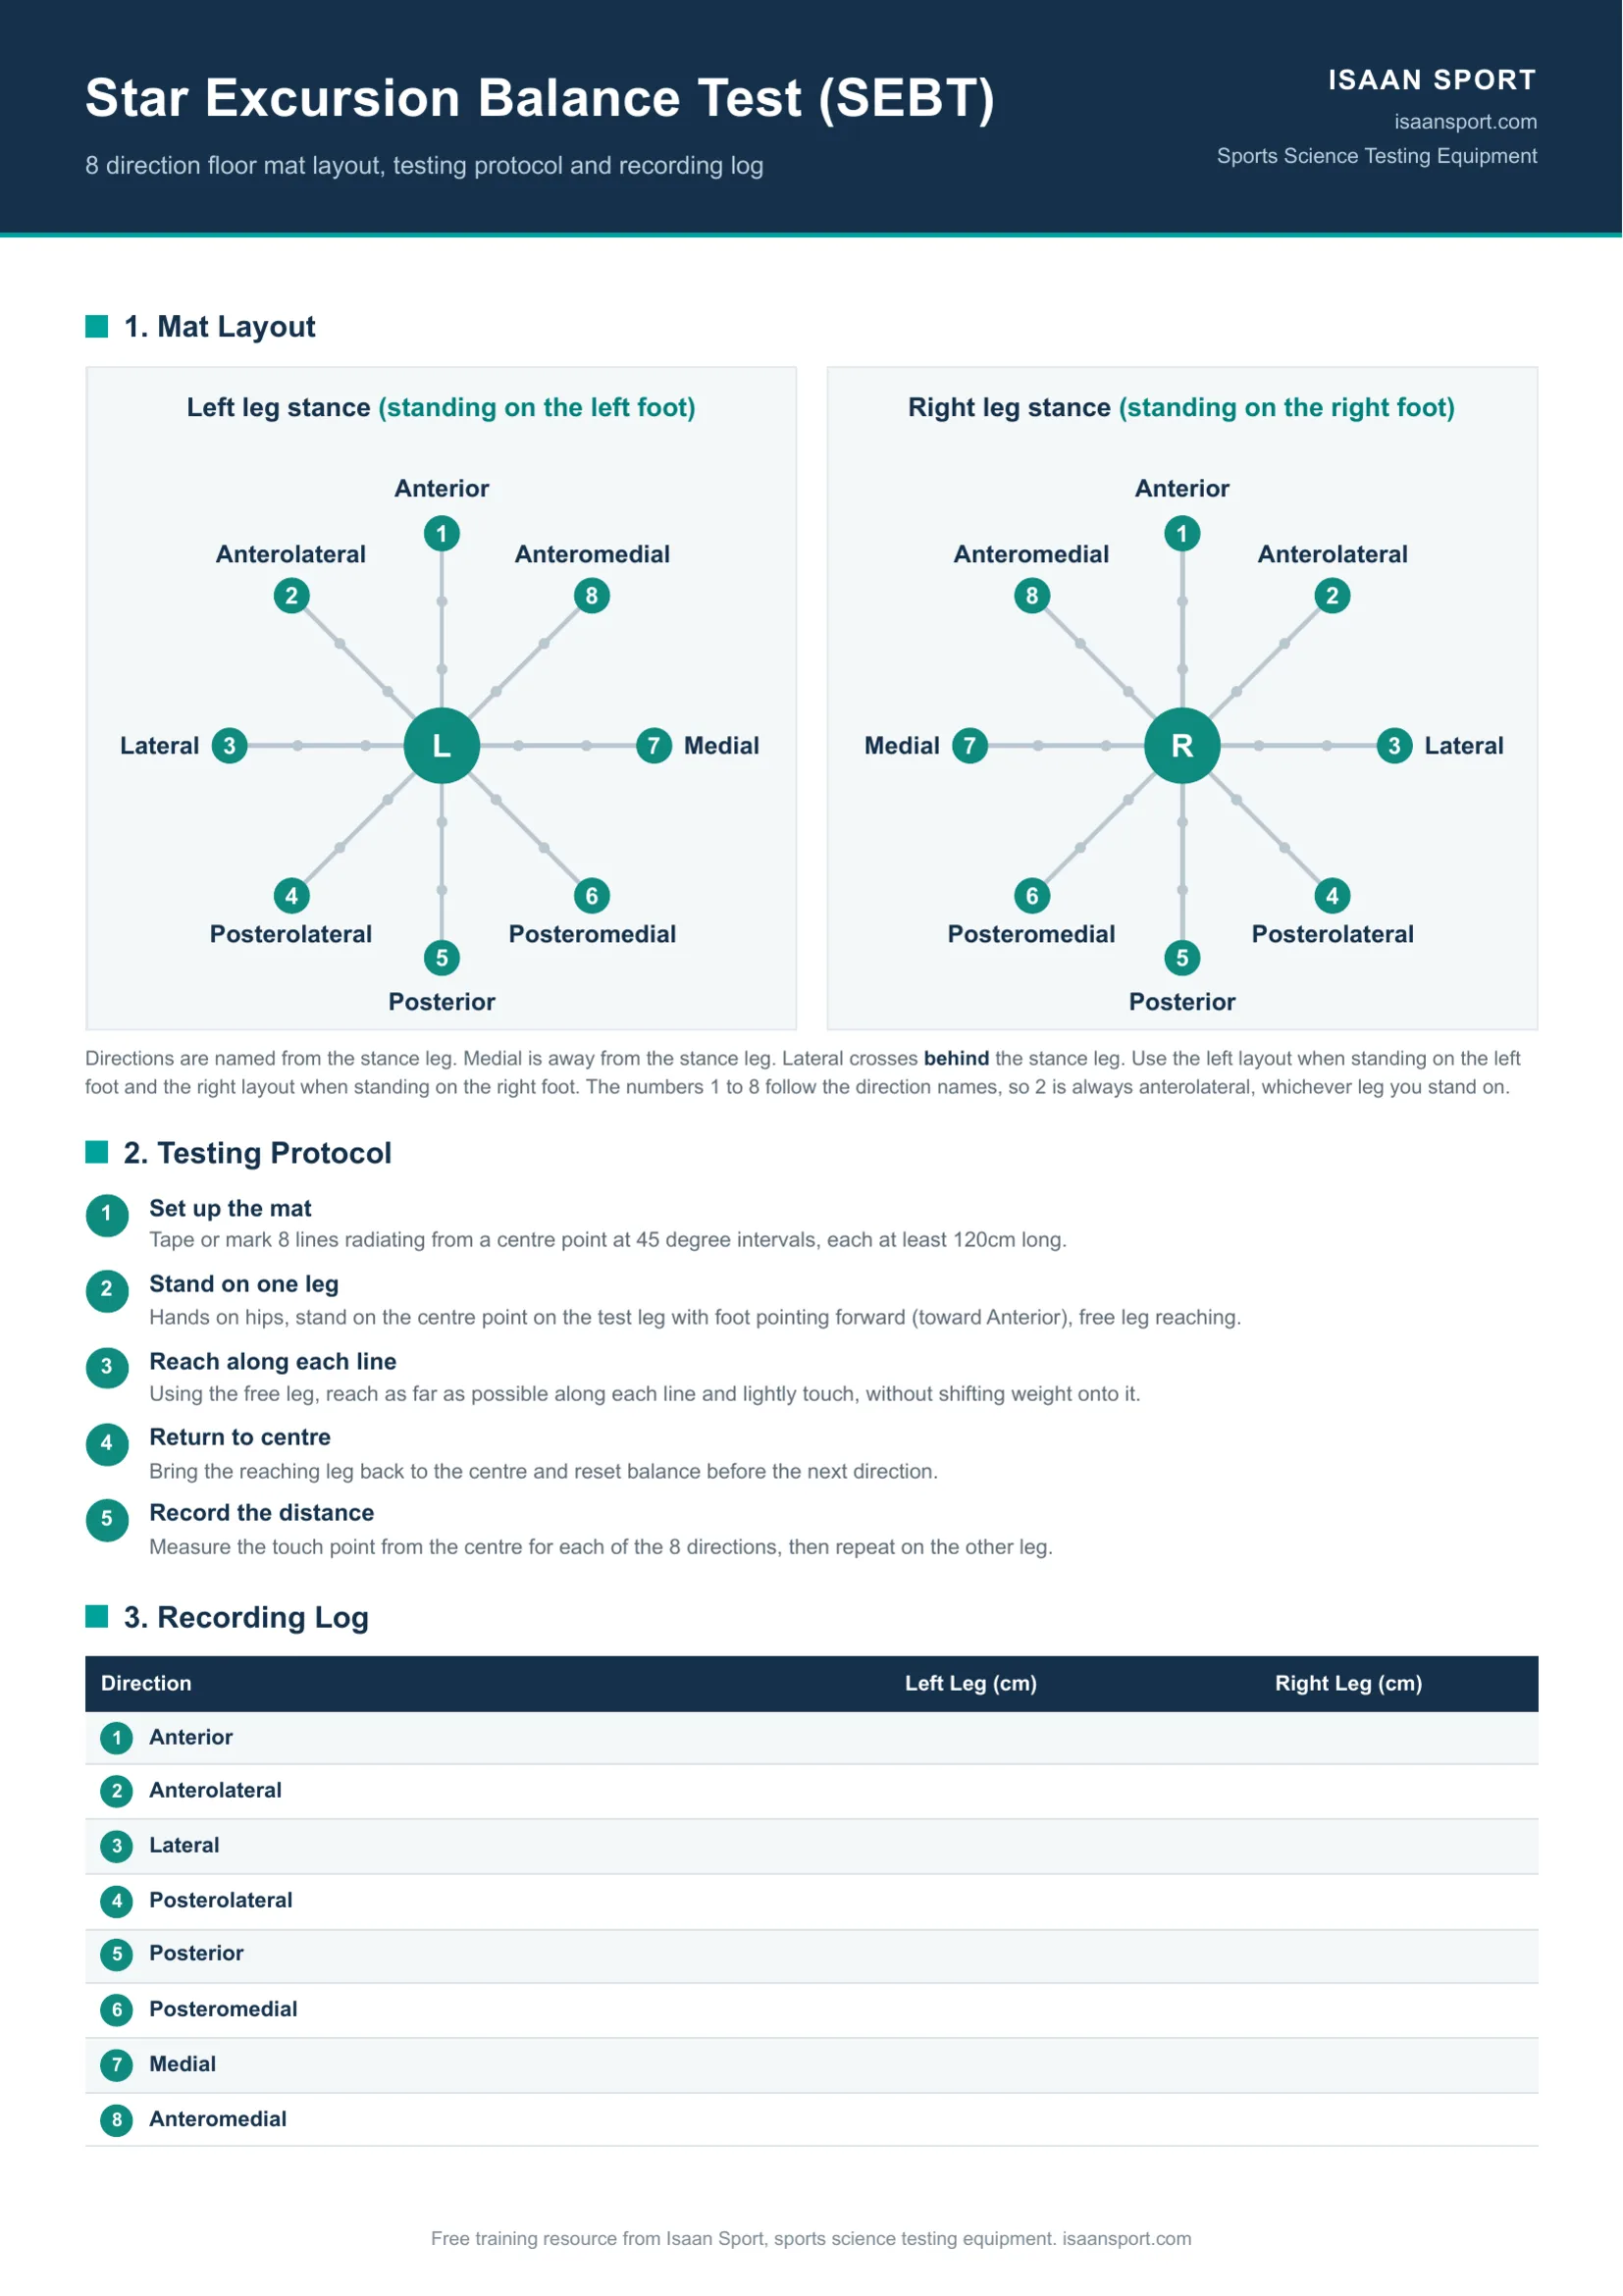
All figures show reach as a percentage of leg length (%LL), with leg length measured from the bony point at the front of the hip (ASIS) to the inside ankle bone. To mark out the test, use our free Star Excursion Balance Test printable.
SEBT Norms for the 3 Direction Test
Most recent studies test only the anterior, posteromedial and posterolateral directions, often called the modified SEBT, and combine them into a composite score.
| Group | n | Anterior | Posteromedial | Posterolateral | Composite |
|---|---|---|---|---|---|
| Elite under 18 female handball players | 188 | 65.2 | 110.0 | 107.1 | 94.1 |
| Elite adult athletes (Romania), right leg | 122 | 81.59 | 97.33 | 104.66 | 94.53 |
| Elite adult athletes (Romania), left leg | 122 | 80.12 | 99.13 | 106.64 | 95.3 |
| Male high school soccer players (Japan) | 11 | 73.3 | 106.6 | 105.4 | 95.1 |
| University students (Japan) | 35 | 77.2 | 95.7 | 102.8 | |
| Under 20 male professional club soccer players (Brazil) | 26 | 61.3 | 97.9 | 99.1 | 85.5 |
Group means. Handball: aged 16.8, barefoot, hands on hips, tip of the big toe at the centre, 4 practice reaches then the mean of 3, legs pooled.2 Elite adults: first and second division soccer, basketball and volleyball players aged 18 to 35, men and women together, hands on hips, third of 3 recorded reaches.3 Japanese soccer: barefoot, kicking leg, 6 practice reaches then the best of 3, baseline before a no exercise session.4 Japanese students: 23 men and 12 women, heel kept down, mean of the last 3 of 9 reaches, legs averaged, no composite reported.5 Brazilian soccer: barefoot, hands on hips, big toe at the centre, 4 practice reaches then the mean of 3, kicking leg.6
The anterior averages spread from about 61% to 82%, far more than the two back directions. Anterior reach depends heavily on how the test is run, so compare it only with figures from the same protocol.
SEBT Norms for All 8 Directions
| Direction | Active adults (US), in shoes | Field hockey players (India) | Football players (India) |
|---|---|---|---|
| 1 Anterior | 86.1 | 84.97 | 87.02 |
| 2 Anterolateral | 78.2 | 77.55 | 78.54 |
| 3 Lateral | 78.4 | 94.09 | 89.38 |
| 4 Posterolateral | 93.4 | 103.64 | 101.58 |
| 5 Posterior | 105.5 | 110.77 | 107.51 |
| 6 Posteromedial | 104.3 | 108.07 | 106.21 |
| 7 Medial | 97.6 | 100.82 | 103.56 |
| 8 Anteromedial | 91.5 | 93.99 | 94.99 |
Group means, numbered as on our printable. US: 36 physically active adults (18 men, 18 women) aged 23.6, in their own athletic shoes, ball of the foot at the centre, standing on the dominant leg, 6 practice reaches then the mean of 3.7 India: 15 field hockey and 15 football university players aged 18 to 25, barefoot, hands on hips, stance heel kept down, 4 practice reaches then the mean of 3, both legs averaged.8
The hockey players reached further than the football players in the posterior and lateral directions.8
SEBT Norms for Asian and Thai Athletes
We found no published SEBT reference values for Thai athletes. The one Thai study we found compared 25 Khon masked dancers with 25 non-dancers, and the dancers reached further in every direction, but its summary does not give the figures.9 The closest Asian figures are the Japanese and Indian groups in the tables above.4,5,8 For a Thai squad, the most useful norms are your own: test the whole squad at the start of the season on the same set-up, record each athlete's scores, and compare each later test with that baseline.
How to Score the SEBT
The reach figures in the tables are reach distance divided by leg length, so work out your own athletes' scores the same way before you compare them.
- Reach (%LL) = reach in centimetres ÷ leg length in centimetres × 10013
- Composite (%) = (anterior + posteromedial + posterolateral) ÷ (3 × leg length) × 10014
An example: an athlete with an 88 cm leg who reaches 67 cm anterior, 86 cm posteromedial and 79 cm posterolateral has an anterior reach of 67 ÷ 88 × 100 = 76.1%, and a composite of (67 + 86 + 79) ÷ (3 × 88) × 100 = 87.9%.
Why SEBT Norms Differ Between Studies
- Best or average. Taking the best reach gives significantly higher results than averaging 3 reaches. A systematic review recommends the average of 3, because it is more reliable.10
- Hands on hips or free. Letting the arms move gives significantly higher scores.10 Most studies on this page kept the hands on the hips.
- Practice reaches. Reliable results need 4 to 6 practice reaches in each direction, though athletes who know the test may need fewer.10
- Shoes, warm-up and set-up. The same review found the effects of footwear, warm-up and a dedicated kit unclear.10 Record what you used so the next test matches.
- Foot position. The handball study put the tip of the big toe at the centre and the US study the ball of the foot.2,7 Where the foot sits moves the starting point of every reach, so keep it the same each time.
SEBT Cut-off Scores
Two figures from 235 high school basketball players are widely quoted. Players whose right and left anterior reach differed by more than 4 cm had 2.5 times the rate of lower extremity injury, and girls with a composite below 94% of leg length had 6.5 times the rate.11 These come from one study in one sport. The study of 393 university athletes concluded that SEBT results and injury risk should be read in the context of the athlete's sport.1 Use the figures to start a conversation with the athlete and coach, not as a pass or fail line.
How much does a score need to change to be a real change?
In 122 elite athletes tested within one session, the smallest detectable change was 2.54 to 4.61 points for anterior reach, 7.02 to 7.94 points for the two back directions and 4.64 to 4.78 points for the composite.3 A smaller change than that may be measurement noise rather than a real improvement.
Common Questions
What is a good SEBT score?
A good score is one at or above the average for athletes like yours, tested the same way. In US university athletes, team average composites ranged from 82% to 92% of leg length,1 and elite under 18 handball players averaged 94.1%.2 A small difference between legs matters as well: an anterior gap of more than 4 cm was linked with more injuries in high school basketball.11
What is a normal anterior reach on the SEBT?
On the 3 direction test, most healthy groups on this page averaged between 61% and 78% of leg length, with one elite adult group at 80% to 82%.1,2,3,4,5,6 On the 8 direction test, the averages were 85% to 87%.7,8 Anterior reach varies most between protocols, so compare it only with figures from the same set-up.
Do men and women score differently on the SEBT?
Not by much in most sports. In 393 US university athletes, the only difference between the sexes in anterior reach was in soccer, where men reached less than women.1 Differences between sports showed up in more directions, so compare an athlete with others in their own sport where you can, whatever their sex.
Can I compare SEBT scores with Y Balance Test norms?
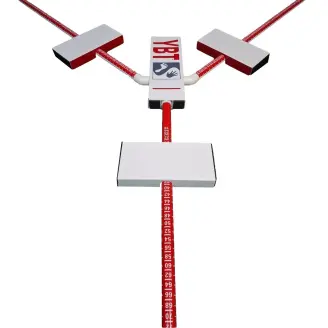
Only for the two back directions. In 20 active men, anterior reach was further on the floor test than on the Y Balance Test kit, while posteromedial and posterolateral reach did not differ.12 Use Y Balance Test norms for results from the kit, and the figures on this page for results from the floor.
Related Reading
- Star Excursion Balance Test instructions, a free printable with the 8 direction layout, protocol and recording log.
- YBT norms, published scores by sport, level and age.
- SEBT test mats in anti-slip rubber backed nylon and soft velvet carpet, with the eight reach lines printed on.
References
- Stiffler MR, Sanfilippo JL, Brooks MA, Heiderscheit BC. Star Excursion Balance Test performance varies by sport in healthy Division I collegiate athletes. Journal of Orthopaedic and Sports Physical Therapy. 2015;45(10):772-780. doi:10.2519/jospt.2015.5777
- Picot B, Dury J, Néron G, McKeon PO, Forestier N. Establishing normative dynamic postural control values in elite female handball players. International Journal of Sports Physical Therapy. 2022;17(6):1083-1094. doi:10.26603/001c.38174
- Onofrei RR, Amaricai E, Petroman R, Suciu O. Relative and absolute within-session reliability of the modified Star Excursion Balance Test in healthy elite athletes. PeerJ. 2019;7:e6999. doi:10.7717/peerj.6999
- Imai A, Kaneoka K, Okubo Y, Shiraki H. Comparison of the immediate effect of different types of trunk exercise on the star excursion balance test in male adolescent soccer players. International Journal of Sports Physical Therapy. 2014;9(4):428-435.
- Ito S, Suzuki R, Hiramatsu K, Igawa T, Urata R, Takahashi H, Ito R, Suzuki K, Maeda Y. Physical function factors associated with the modified star excursion balance test in healthy university students. Journal of Physical Therapy Science. 2026;38(8):335-340. doi:10.1589/jpts.38.335
- de Mesquita RS, Machado ML, Munari VG, Scirea JC, da Cruz Dorneles B, de Menezes FS, Migliorini F, Maffulli N, Okubo R. The anterior reach of the modified Star Excursion Balance Test shows a strong relationship with ankle dorsiflexion in young athletes: a cross-sectional observational study. European Journal of Medical Research. 2025;30(1):1226. doi:10.1186/s40001-025-03625-w
- Hardy L, Huxel K, Brucker J, Nesser T. Prophylactic ankle braces and star excursion balance measures in healthy volunteers. Journal of Athletic Training. 2008;43(4):347-351. doi:10.4085/1062-6050-43.4.347
- Bhat R, Moiz JA. Comparison of dynamic balance in collegiate field hockey and football players using star excursion balance test. Asian Journal of Sports Medicine. 2013;4(3):221-229. doi:10.5812/asjsm.34287
- Krityakiarana W, Jongkamonwiwat N. Greater Star Excursion Balance Test performance in Thai Khon masked dancers versus nondancers. Journal of Dance Medicine and Science. 2022;26(3):146-154. doi:10.12678/1089-313x.091522a
- Zając B, Olszewski M, Mika A. Influence of protocol variables on outcomes of the star excursion balance test group (SEBT, mSEBT, YBT-LQ) in healthy individuals: a systematic review. Frontiers in Physiology. 2024;15:1415887. doi:10.3389/fphys.2024.1415887
- Plisky PJ, Rauh MJ, Kaminski TW, Underwood FB. Star Excursion Balance Test as a predictor of lower extremity injury in high school basketball players. Journal of Orthopaedic and Sports Physical Therapy. 2006;36(12):911-919. doi:10.2519/jospt.2006.2244
- Coughlan GF, Fullam K, Delahunt E, Gissane C, Caulfield BM. A comparison between performance on selected directions of the star excursion balance test and the Y balance test. Journal of Athletic Training. 2012;47(4):366-371. doi:10.4085/1062-6050-47.4.03
- Gribble PA, Kelly SE, Refshauge KM, Hiller CE. Interrater reliability of the star excursion balance test. Journal of Athletic Training. 2013;48(5):621-626.
- Plisky PJ, Gorman PP, Butler RJ, Kiesel KB, Underwood FB, Elkins B. The reliability of an instrumented device for measuring components of the star excursion balance test. North American Journal of Sports Physical Therapy. 2009;4(2):92-99.
Dr Wannaporn Sumranpat Brady is a physiotherapist with a PhD, not a medical doctor, and a lecturer in the Department of Health Science and Sports at Mahasarakham University's Faculty of Education. Her research is on patellofemoral pain (PFP). She holds a PhD in Exercise and Sport Science from Mahasarakham University, an MSc in Physical Therapy from Khon Kaen University and a BSc in Physical Therapy from Naresuan University, and has also published on athletic injury rehabilitation, sports biomechanics and physical training programme design. She co-founded Isaan Sport Technology and writes its sports science articles, which take their figures from journal studies and from tests on the equipment the store sells.