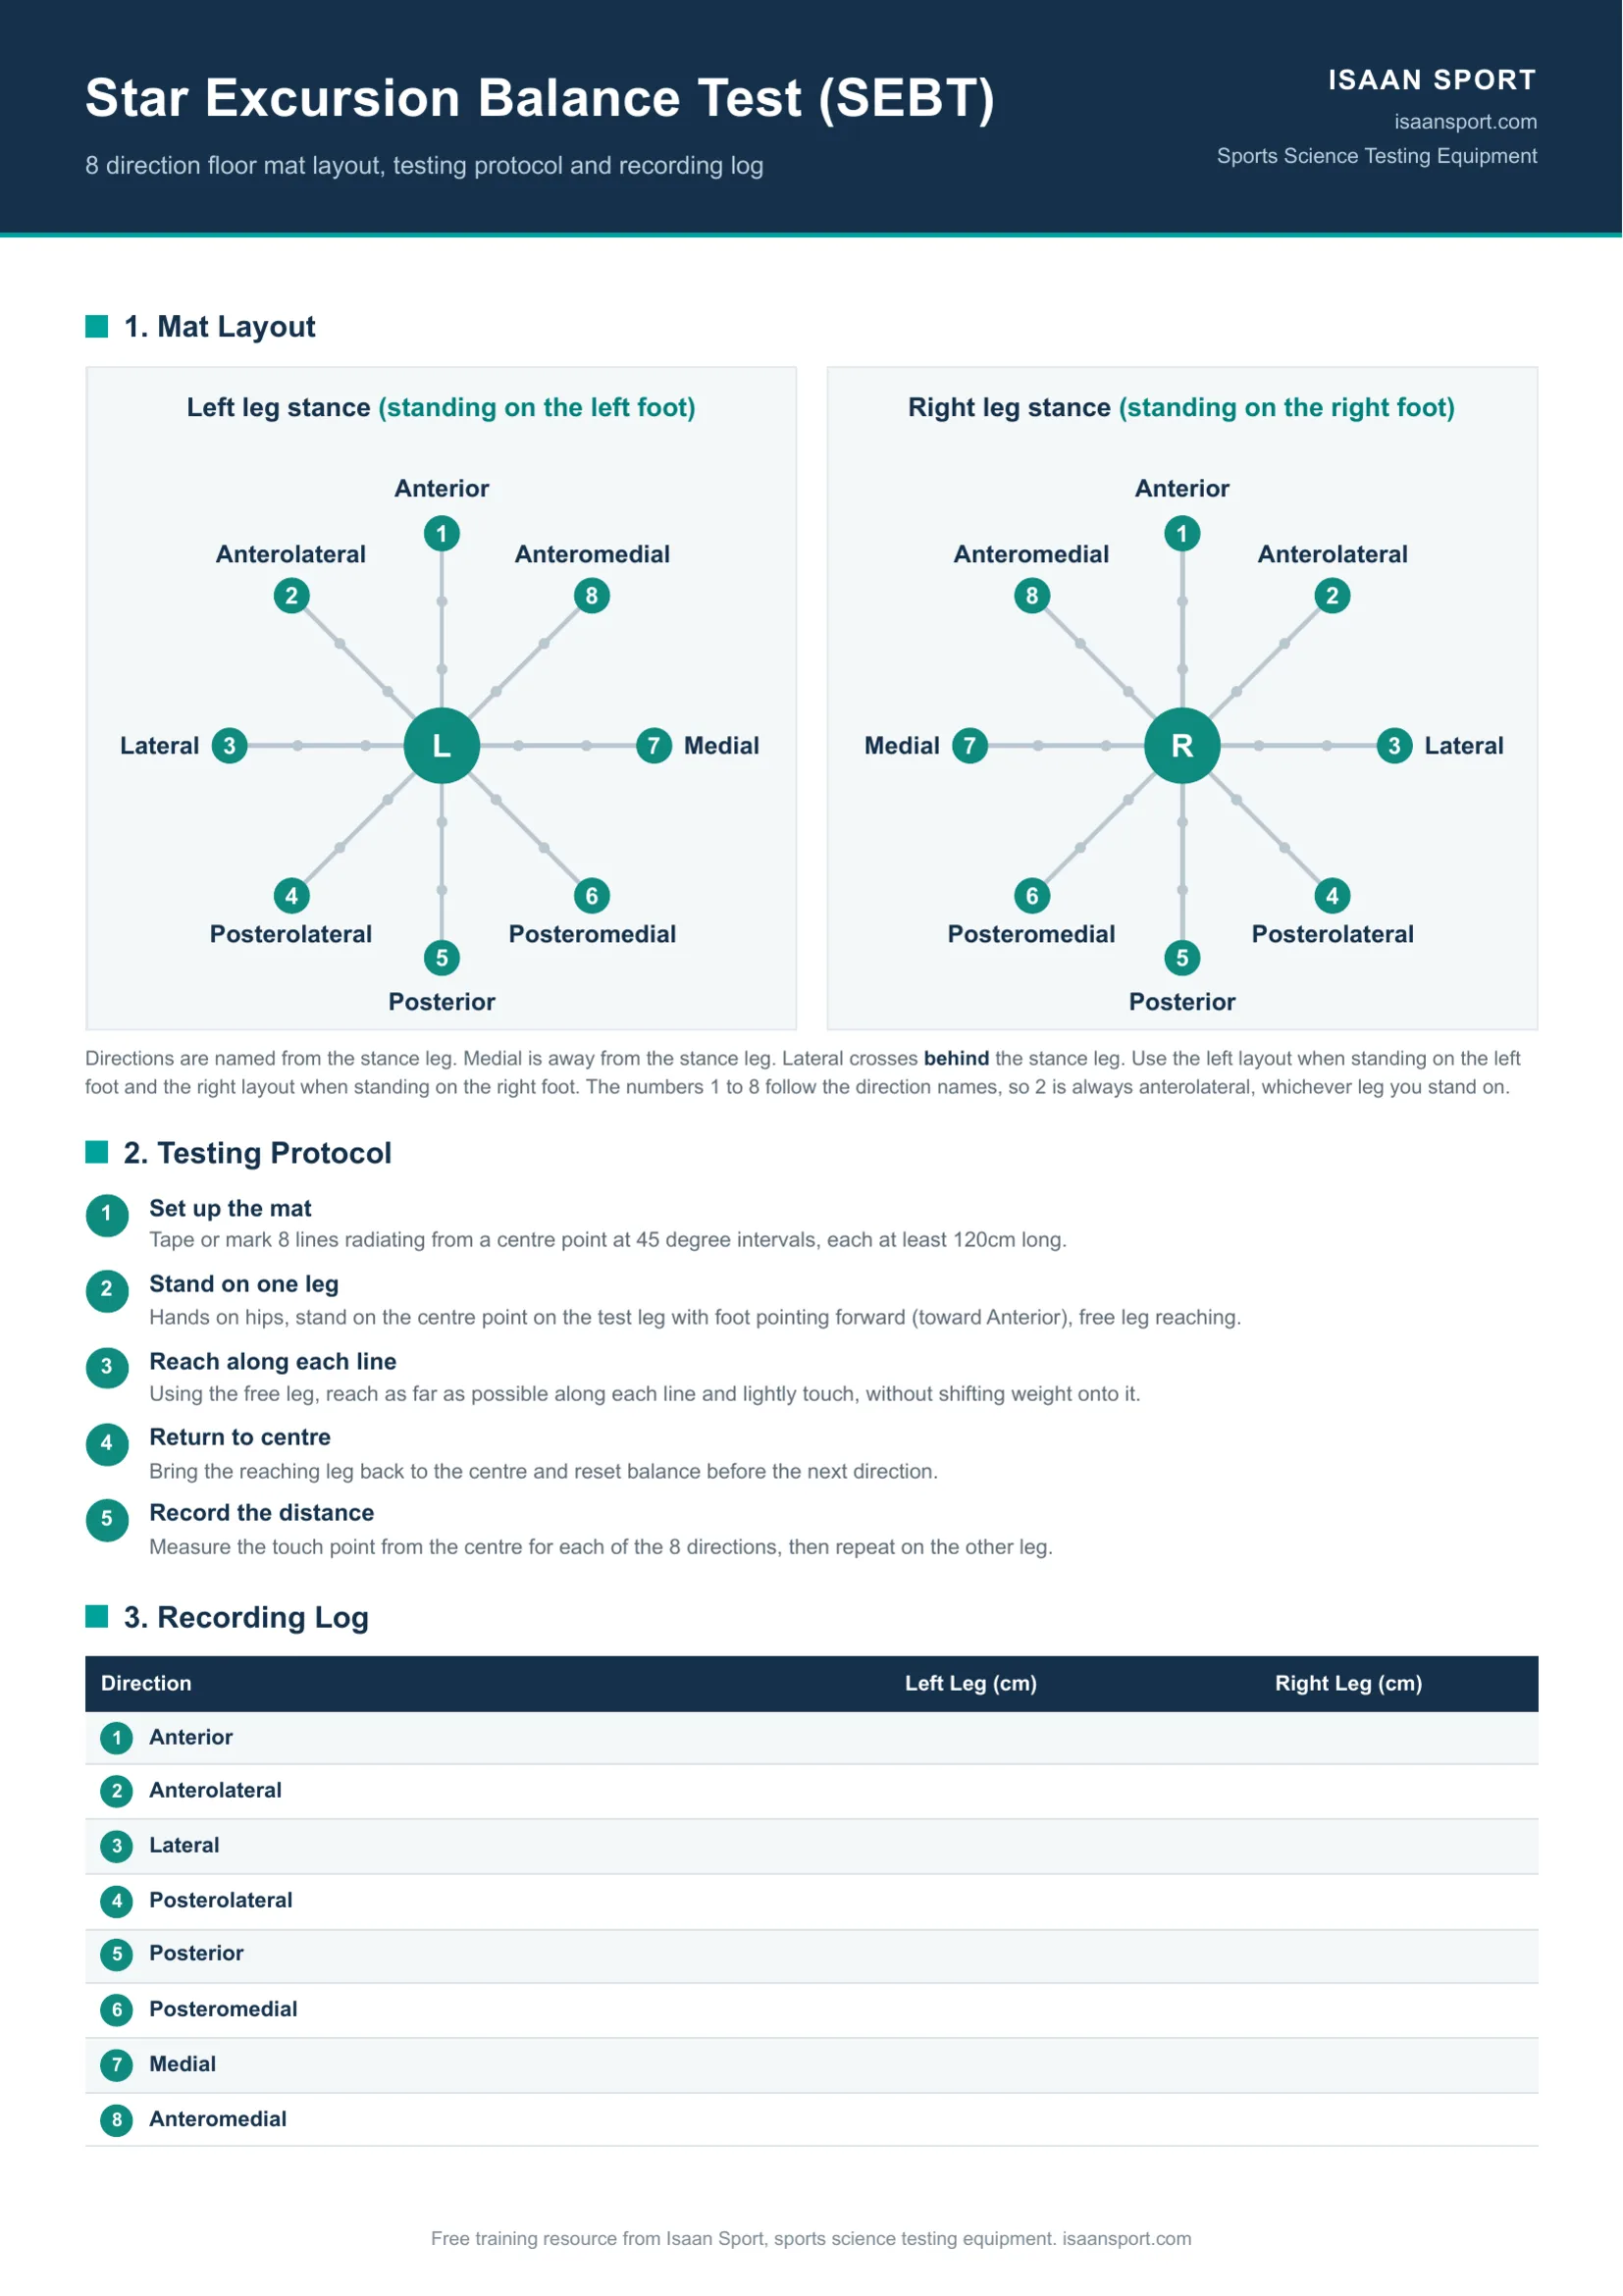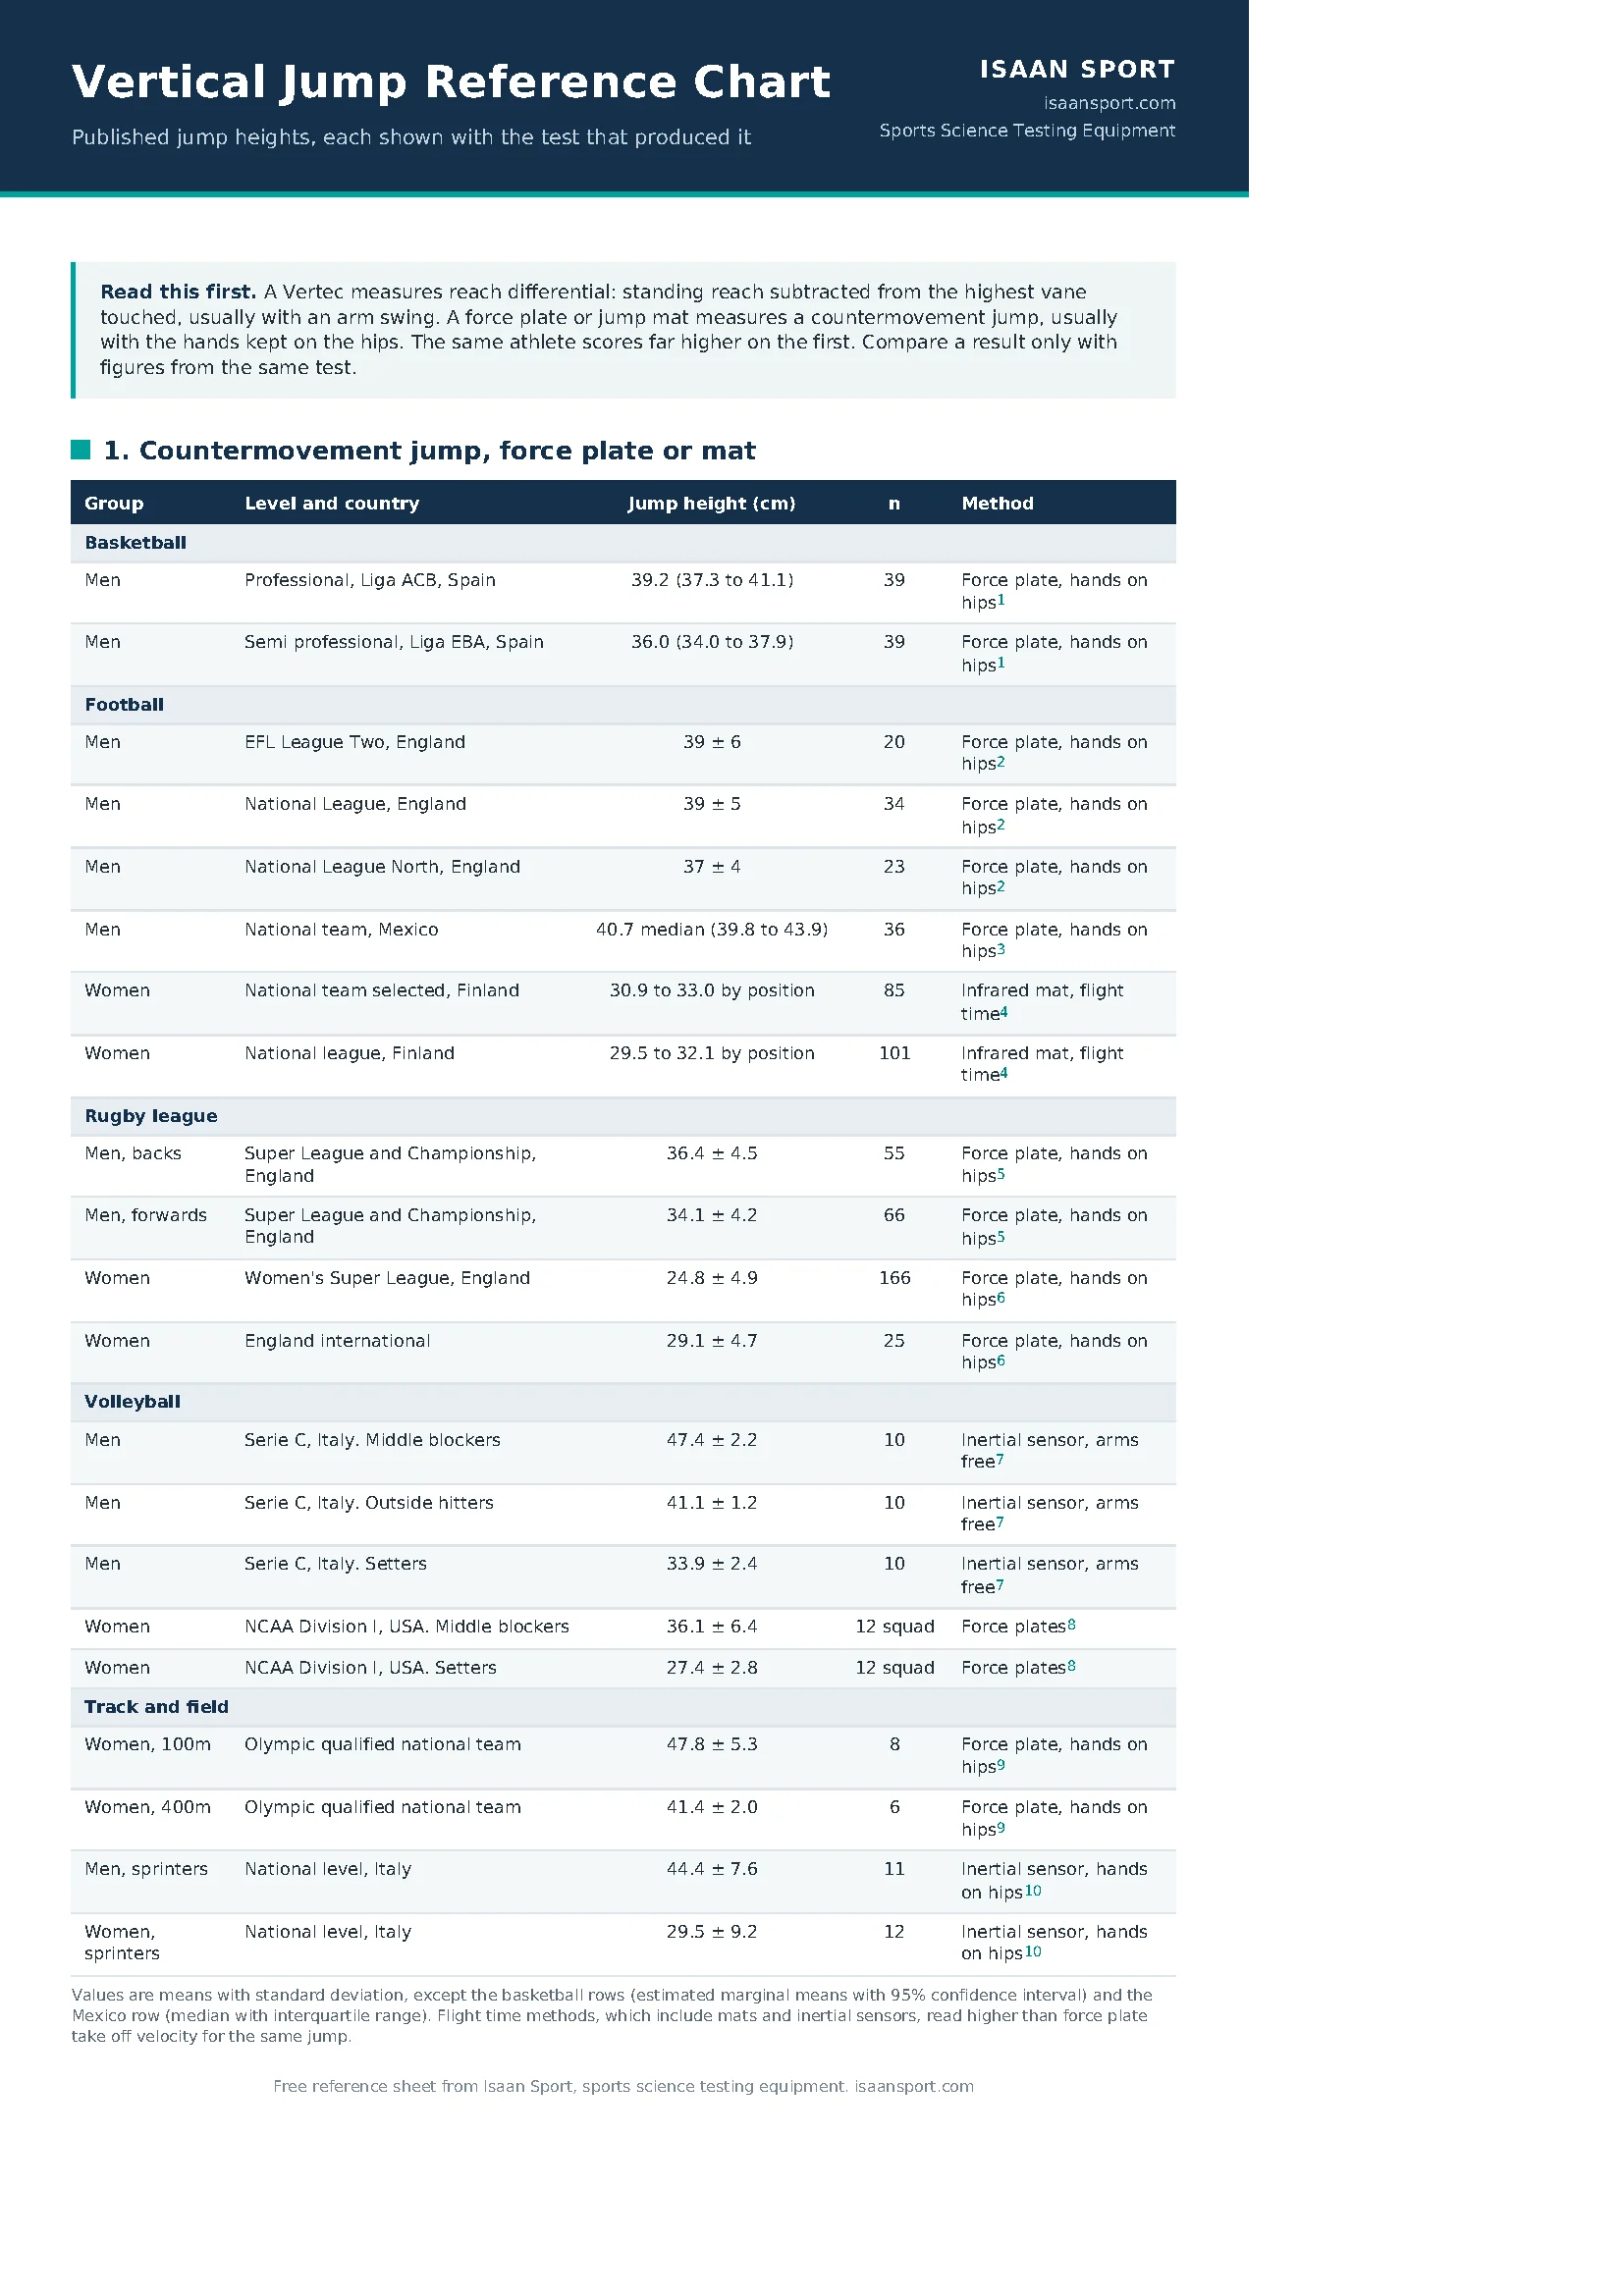
Free printable: the norms tables, scoring formulas, cut-off scores and a test and retest recording log on two A4 pages.
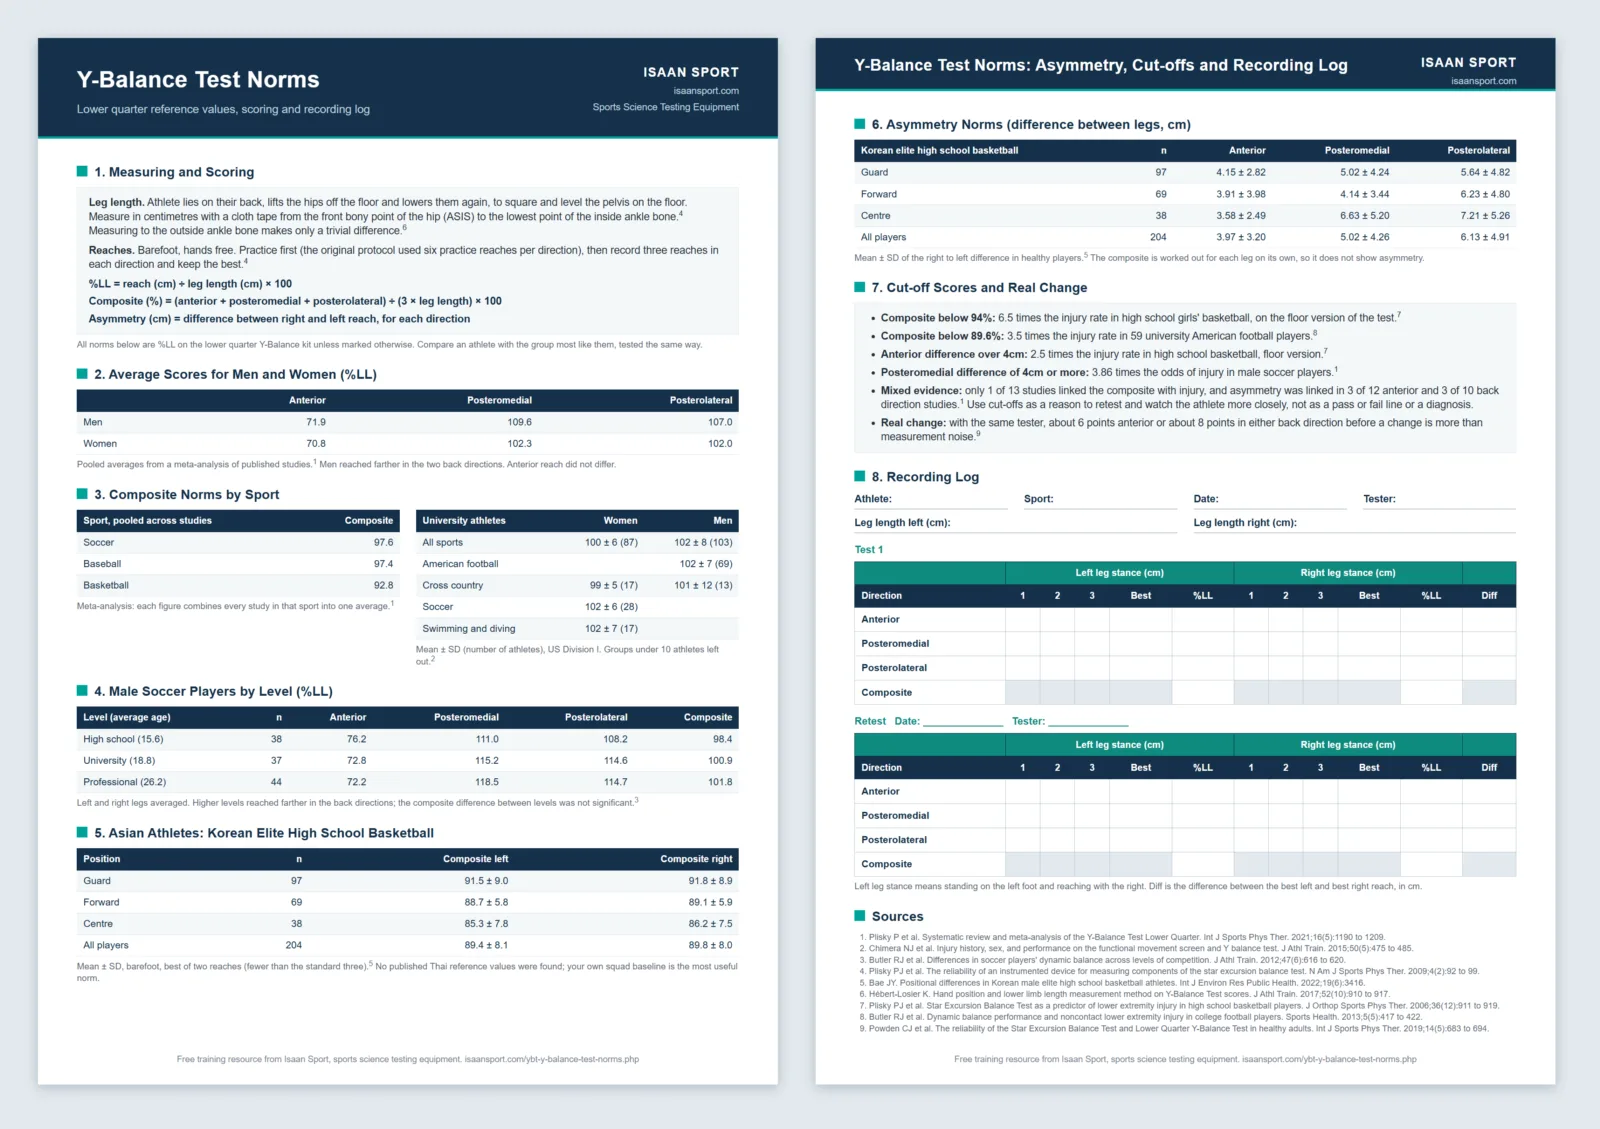
All figures show reach as a percentage of leg length (%LL), on the lower quarter Y-Balance Test unless the heading says otherwise.
To measure leg length, have the athlete lie on their back, lift the hips off the floor and lower them again, to square and level the pelvis on the floor, then measure in centimetres with a cloth tape from the bony point at the front of the hip (the anterior superior iliac spine, or ASIS) to the lowest point of the inside ankle bone.4 Divide each reach by leg length and multiply by 100 to get %LL. Measuring to the outside ankle bone instead, as older protocols did, makes only a trivial difference to scores.12
Average Y-Balance Test Scores for Men and Women
| Anterior | Posteromedial | Posterolateral | |
|---|---|---|---|
| Men | 71.9 | 109.6 | 107.0 |
| Women | 70.8 | 102.3 | 102.0 |
Pooled averages from a meta-analysis of published studies.1 Men reached farther in the two back directions. Anterior reach did not differ.
Y-Balance Test Norms by Sport
| Sport (pooled across studies) | Composite |
|---|---|
| Soccer | 97.6 |
| Baseball | 97.4 |
| Basketball | 92.8 |
Pooled composites by sport from the same meta-analysis: each figure combines the results of every study in that sport into one average.1 The composite is the average of the three reaches (anterior, posteromedial and posterolateral) as a percentage of leg length, so a composite of 95% means the three reaches averaged 95% of leg length.
University athletes by sport and sex
| Sport | Women | Men |
|---|---|---|
| All sports | 100 ± 6 (87) | 102 ± 8 (103) |
| Basketball | 98 ± 0 (2) | 98 ± 6 (9) |
| Cross country | 99 ± 5 (17) | 101 ± 12 (13) |
| American football | 102 ± 7 (69) | |
| Soccer | 102 ± 6 (28) | |
| Swimming and diving | 102 ± 7 (17) | |
| Tennis | 99 ± 6 (5) | 107 ± 5 (5) |
| Track and field | 92 ± 14 (3) | 106 ± 6 (7) |
| Volleyball | 99 ± 8 (8) |
Composite, mean ± standard deviation (number of athletes), US Division I university athletes. Barefoot, 4 to 6 practice reaches, best of three, leg length to the inside ankle bone.2 Groups with fewer than 10 athletes are too small to use as a benchmark on their own.
Y-Balance Test Norms for Soccer Players by Level
| Male soccer players | n | Anterior | Posteromedial | Posterolateral | Composite |
|---|---|---|---|---|---|
| High school (15.6 y) | 38 | 76.2 | 111.0 | 108.2 | 98.4 |
| University (18.8 y) | 37 | 72.8 | 115.2 | 114.6 | 100.9 |
| Professional (26.2 y) | 44 | 72.2 | 118.5 | 114.7 | 101.8 |
Means, left and right legs averaged. Barefoot, 6 practice reaches then 3 recorded.3 Players at higher levels reached farther in the posteromedial and posterolateral directions, while the high school players had the longest anterior reach. The composite difference between levels was not significant. The founding protocol study, on 15 university soccer players tested in shoes, reported a right leg composite of 105.7 ± 3.4.4
A similar pattern turned up in baseball, where professional players had higher posteromedial, posterolateral and composite scores than high school and university players, and high school players again had the longest anterior reach.5
Y-Balance Test Norms for Asian Athletes
We found no published Y-Balance Test reference values for Thai athletes. The closest Asian athlete data come from 204 Korean elite high school basketball players, tested barefoot on a Y-Balance kit:6
| Position | n | Composite left | Composite right |
|---|---|---|---|
| Guard | 97 | 91.5 ± 9.0 | 91.8 ± 8.9 |
| Forward | 69 | 88.7 ± 5.8 | 89.1 ± 5.9 |
| Centre | 38 | 85.3 ± 7.8 | 86.2 ± 7.5 |
| All players | 204 | 89.4 ± 8.1 | 89.8 ± 8.0 |
Mean ± standard deviation. This study recorded the best of only two reaches, fewer than the standard three, which may lower the scores slightly.6 Left to right differences are in the asymmetry section below.
Centres scored lowest of the three positions. The squad average fits the meta-analysis figure of 92.8% for basketball, the lowest of the sports pooled.1 For a Thai squad, the most useful norms are your own: test the whole squad at the start of the season, record each athlete's scores, and compare each test with that baseline.
Y-Balance Test Norms for Young Athletes
A study of 669 German school students aged 10 to 17 found that 16 and 17 year old boys reached farther than younger boys and than girls of the same age.7 Reliability is lower in adolescents than in adults, with repeat test correlations of 0.57 to 0.82 compared with 0.85 to 0.91,1 so allow for more test to test variation in school age athletes.
Upper Quarter Y-Balance Test Norms
The upper quarter version is done in a push-up position, reaching with one hand in three directions (medial, inferolateral and superolateral), and is scored against arm length measured from the base of the neck (C7) to the tip of the middle finger with the arm held out to the side.8
| Group | Composite right arm | Composite left arm |
|---|---|---|
| Active adult men (US) | 81.7 | 82.3 |
| Active adult women (US) | 80.7 | 80.7 |
| Men 18 to 36 (India), median | 80.7 | 79.7 |
| Women 18 to 36 (India), median | 76.8 | 75.7 |
US figures from 95 active adults, with no significant difference between sexes or arms.9 Indian figures from 190 healthy adults, using the average of three reaches rather than the best, which gives lower numbers.10
Upper quarter norms for youth aged 10 to 17
| Age | Girls, right arm | Girls, left arm | Boys, right arm | Boys, left arm |
|---|---|---|---|---|
| 10 to 11 | 90.7 (35) | 88.7 | 88.4 (21) | 89.1 |
| 12 to 13 | 84.5 (91) | 84.0 | 80.5 (84) | 80.1 |
| 14 to 15 | 84.3 (88) | 83.1 | 92.6 (130) | 91.1 |
| 16 to 17 | 84.6 (111) | 83.4 | 88.4 (105) | 87.2 |
Mean composite (number tested), 665 German youth. Standard deviations were large, about 11 to 13 points. Best of three reaches after three practice reaches.11
Why Y-Balance Test Norms Differ Between Studies
- Hands free or on the hips. Hands free gives higher posteromedial, posterolateral and composite scores, with an effect size of about 0.5 on the composite.12 The current protocol leaves the hands free; many older studies used hands on hips.
- Best or average of three. Most studies record the best reach; some average the three, which gives lower numbers.1
- Practice reaches. The original protocol used six per direction, because reach keeps improving over the first few attempts.4
- Shoes or barefoot. The founding study tested in athletic shoes and then recommended barefoot.4
- Kit or floor. Anterior reach on the floor based Star Excursion Balance Test is about 3 to 5 points higher, so floor figures do not carry across.
Y-Balance Test Asymmetry Norms
Asymmetry is the difference between the right and left leg in each direction, measured in centimetres rather than as a percentage of leg length. The composite is worked out for each leg on its own, so it does not show asymmetry. Healthy athletes rarely reach the same distance on both legs. In 204 Korean elite high school basketball players, the average differences were:6
| Position | n | Anterior (cm) | Posteromedial (cm) | Posterolateral (cm) |
|---|---|---|---|---|
| Guard | 97 | 4.15 ± 2.82 | 5.02 ± 4.24 | 5.64 ± 4.82 |
| Forward | 69 | 3.91 ± 3.98 | 4.14 ± 3.44 | 6.23 ± 4.80 |
| Centre | 38 | 3.58 ± 2.49 | 6.63 ± 5.20 | 7.21 ± 5.26 |
| All players | 204 | 3.97 ± 3.20 | 5.02 ± 4.26 | 6.13 ± 4.91 |
Mean ± standard deviation of the difference between legs, best of two reaches, barefoot on a Y-Balance kit. Centres had a larger posteromedial difference than forwards.6
The average anterior difference in these healthy players, about 4cm, is the same as the most quoted asymmetry cut-off: in high school basketball players, a right to left anterior difference of more than 4cm went with 2.5 times the injury rate, on the floor version of the test.13 Later studies are mixed. The meta-analysis found a link with injury in 3 of 12 studies of anterior asymmetry and 3 of 10 studies of the two back directions, with thresholds from 2cm to 4cm. One of them found 3.86 times the odds of injury in male soccer players with a posteromedial difference of 4cm or more.1 Treat a difference of 4cm or more as a reason to retest and watch the athlete more closely, not as a diagnosis.
Y-Balance Test Cut-off Scores
Two composite cut-offs are widely quoted. A composite below 94% was linked with 6.5 times the injury rate in high school girls' basketball, on the floor version of the test,13 and below 89.6% with 3.5 times the rate in 59 university American football players, using the Y-Balance protocol.14 The meta-analysis found that only one of 13 studies showed a link between composite score and injury, and cautioned that general cut points may not predict injury.1 Use these figures as context for a conversation with the athlete and their coach, not as a pass or fail line.
How much does a score need to change to be a real change?
With the same tester, a change of about 6 points in anterior reach, or about 8 points in either back direction, is needed before it is more than measurement noise.15
Related Reading
- Star Excursion Balance Test diagram, a free printable for the floor test.
References
- Plisky P, Schwartkopf-Phifer K, Huebner B, Garner MB, Bullock G. Systematic review and meta-analysis of the Y-Balance Test Lower Quarter: reliability, discriminant validity, and predictive validity. International Journal of Sports Physical Therapy. 2021;16(5):1190 to 1209. doi:10.26603/001c.27634
- Chimera NJ, Smith CA, Warren M. Injury history, sex, and performance on the functional movement screen and Y balance test. Journal of Athletic Training. 2015;50(5):475 to 485. doi:10.4085/1062-6050-49.6.02
- Butler RJ, Southers C, Gorman PP, Kiesel KB, Plisky PJ. Differences in soccer players' dynamic balance across levels of competition. Journal of Athletic Training. 2012;47(6):616 to 620. doi:10.4085/1062-6050-47.5.14
- Plisky PJ, Gorman PP, Butler RJ, Kiesel KB, Underwood FB, Elkins B. The reliability of an instrumented device for measuring components of the star excursion balance test. North American Journal of Sports Physical Therapy. 2009;4(2):92 to 99. PubMed 21509114
- Butler RJ, Bullock G, Arnold T, Plisky P, Queen R. Competition-level differences on the Lower Quarter Y-Balance Test in baseball players. Journal of Athletic Training. 2016;51(12):997 to 1002. doi:10.4085/1062-6050-51.12.09
- Bae JY. Positional differences in physique, physical strength, and lower extremity stability in Korean male elite high school basketball athletes. International Journal of Environmental Research and Public Health. 2022;19(6):3416. doi:10.3390/ijerph19063416
- Schwiertz G, Brueckner D, Beurskens R, Muehlbauer T. Lower Quarter Y Balance Test performance: reference values for healthy youth aged 10 to 17 years. Gait and Posture. 2020;80:148 to 154. doi:10.1016/j.gaitpost.2020.05.041
- Westrick RB, Miller JM, Carow SD, Gerber JP. Exploration of the Y-balance test for assessment of upper quarter closed kinetic chain performance. International Journal of Sports Physical Therapy. 2012;7(2):139 to 147. PubMed 22530188
- Gorman PP, Butler RJ, Plisky PJ, Kiesel KB. Upper Quarter Y Balance Test: reliability and performance comparison between genders in active adults. Journal of Strength and Conditioning Research. 2012;26(11):3043 to 3048. doi:10.1519/JSC.0b013e3182472fdb
- Pavithran A, Rajasekar S, Cleland J, Ramkumar V, Hazari A. Normative value of upper extremity Y balance test in healthy subjects aged between 18 and 36 years from South India. PLoS One. 2025;20(10):e0335443. doi:10.1371/journal.pone.0335443
- Schwiertz G, Bauer J, Muehlbauer T. Upper Quarter Y Balance test performance: normative values for healthy youth aged 10 to 17 years. PLoS One. 2021;16(6):e0253144. doi:10.1371/journal.pone.0253144
- Hébert-Losier K. Clinical implications of hand position and lower limb length measurement method on Y-Balance Test scores and interpretations. Journal of Athletic Training. 2017;52(10):910 to 917. doi:10.4085/1062-6050-52.8.02
- Plisky PJ, Rauh MJ, Kaminski TW, Underwood FB. Star Excursion Balance Test as a predictor of lower extremity injury in high school basketball players. Journal of Orthopaedic and Sports Physical Therapy. 2006;36(12):911 to 919. doi:10.2519/jospt.2006.2244
- Butler RJ, Lehr ME, Fink ML, Kiesel KB, Plisky PJ. Dynamic balance performance and noncontact lower extremity injury in college football players: an initial study. Sports Health. 2013;5(5):417 to 422. doi:10.1177/1941738113498703
- Powden CJ, Dodds TK, Gabriel EH. The reliability of the Star Excursion Balance Test and Lower Quarter Y-Balance Test in healthy adults: a systematic review. International Journal of Sports Physical Therapy. 2019;14(5):683 to 694. PubMed 31598406
Dr Wannaporn Sumranpat Brady is a physiotherapist with a PhD, not a medical doctor, and a lecturer in the Department of Health Science and Sports at Mahasarakham University's Faculty of Education. Her research is on patellofemoral pain (PFP). She holds a PhD in Exercise and Sport Science from Mahasarakham University, an MSc in Physical Therapy from Khon Kaen University and a BSc in Physical Therapy from Naresuan University, and has also published on athletic injury rehabilitation, sports biomechanics and physical training programme design. She co-founded Isaan Sport Technology and writes its sports science articles, which take their figures from journal studies and from tests on the equipment the store sells.