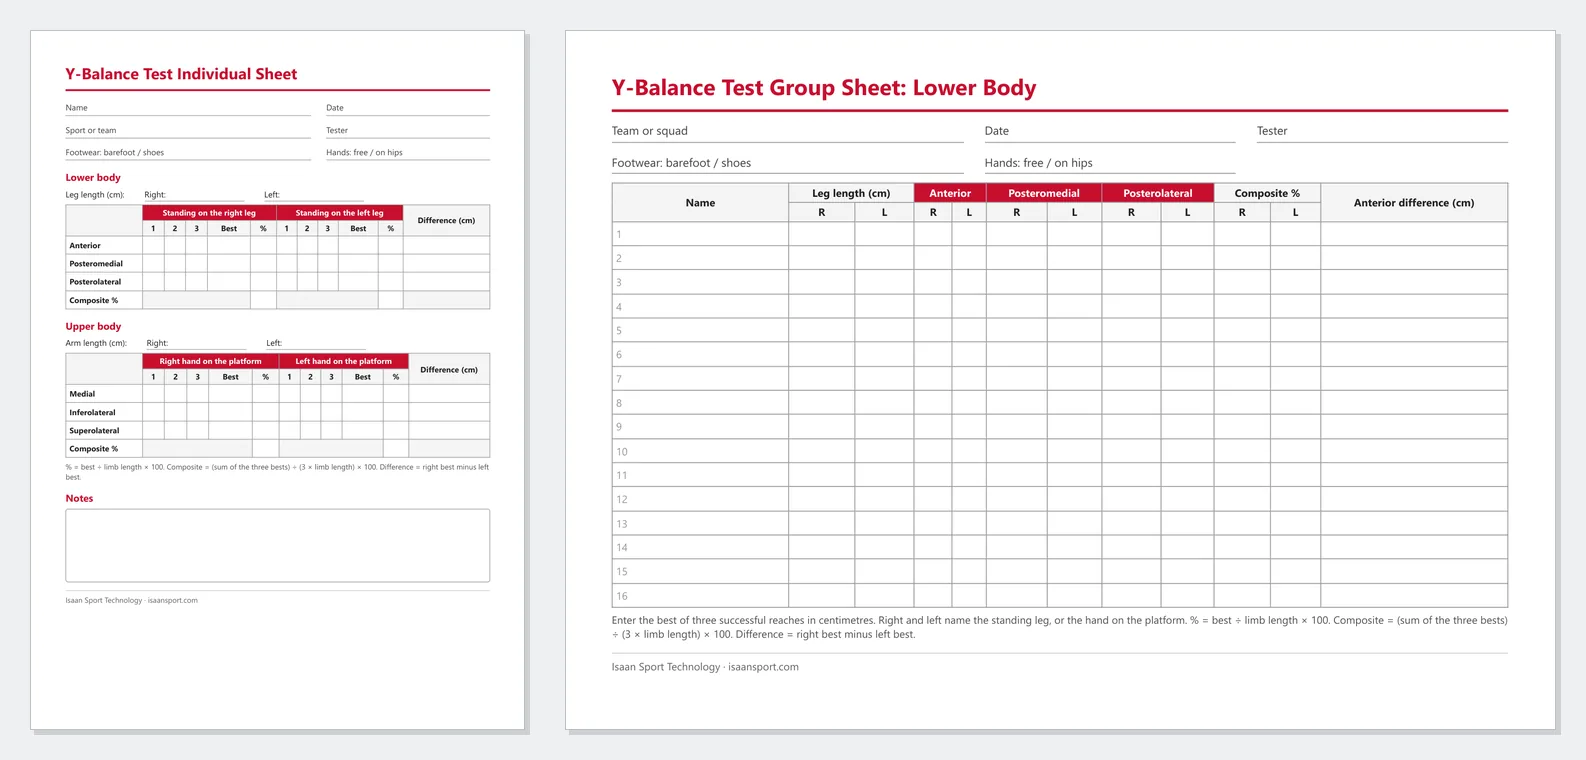
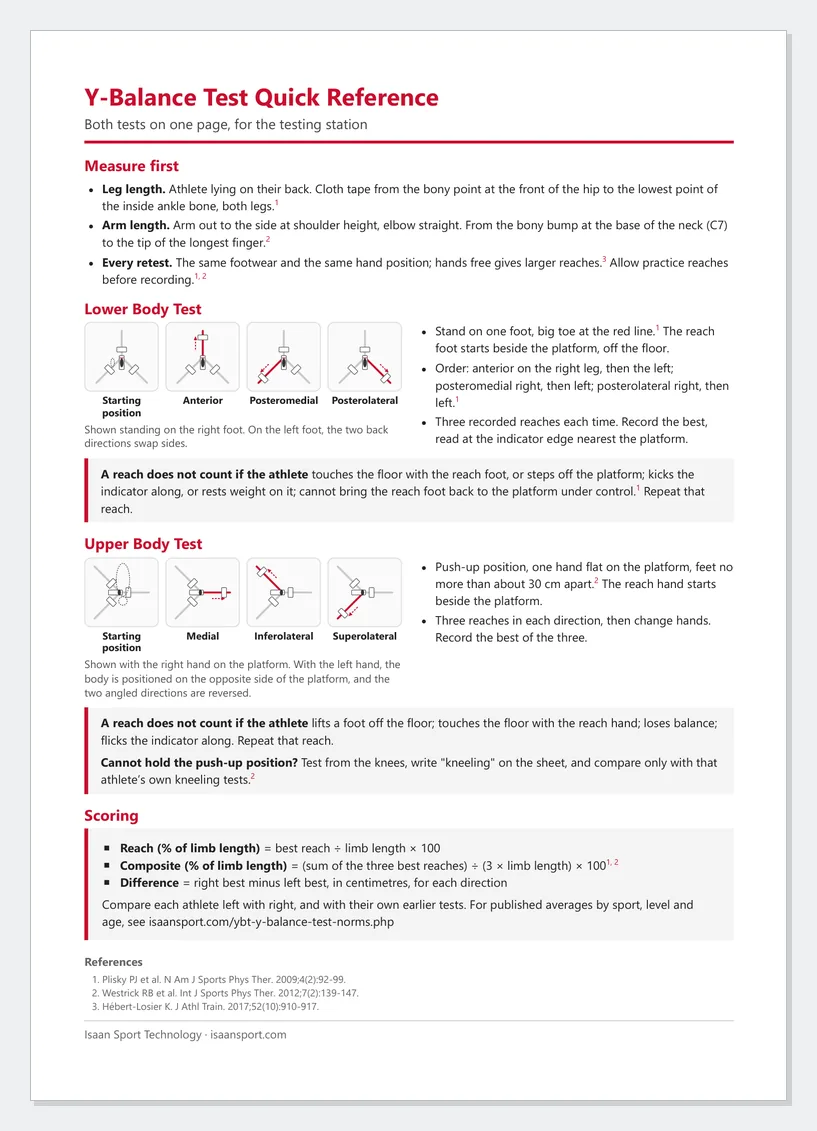
Testing a squad? Print our free Y-Balance Test recording sheets, which have boxes for all three reaches in each direction on both sides, then enter each athlete's best reaches here. Copy results puts the scores on the clipboard as text, ready to paste into a message or a spreadsheet. One side on its own works too; the right minus left difference appears once both sides are filled in.
How the Calculator Works
Raw reach in centimetres favours tall athletes, so each reach is divided by the length of the stance leg. Both formulas come from the paper that set out the instrumented Y-Balance Test protocol:1
Reach in one direction (% of leg length) = reach ÷ leg length × 100
Composite score (% of leg length) = (anterior + posteromedial + posterolateral) ÷ (3 × leg length) × 100
A worked example: leg length 88 cm, with best reaches of 62 cm anterior, 98 cm posteromedial and 94 cm posterolateral. The anterior score is 62 ÷ 88 × 100 = 70.5%. The composite is (62 + 98 + 94) ÷ (3 × 88) × 100 = 254 ÷ 264 × 100 = 96.2%.
The calculator also gives the difference between the sides in each direction in centimetres, worked out as right minus left, the same way as on our recording sheets, so a plus sign means the right side reached farther. In the lower body test it flags an anterior difference of more than 4 cm, the cut-off used in the screening studies described below.2,3 It also shows a posteromedial or posterolateral difference of 4 cm or more, with a note that the evidence for those directions is weaker.4,9 The difference is worked out on raw centimetres, as those studies did, not on percentages. Under the table it shows the pooled published averages for men and women in each direction for the lower body test,4 and the averages for active adults for the upper body test.7
How to Measure Leg Length for the Y-Balance Test
The athlete lies on their back, lifts the hips off the floor and lowers them again, and the tester straightens both legs to level the pelvis. Leg length is then measured with a cloth tape from the bony point at the front of the hip (the anterior superior iliac spine, or ASIS) to the lowest point of the inside ankle bone (the medial malleolus).1 Measure both legs. Some older studies measured to the outside ankle bone instead; the difference this makes to the scores is trivial.6
Y-Balance Test Protocol in Brief
- Barefoot, toes at the line. The athlete stands on one foot on the centre platform, with the tip of the big toe at the start line (the red line on our kit).1
- Practise first. The original protocol used six practice reaches per direction on each leg, because reach keeps improving over the first few attempts.1
- Three recorded reaches in a fixed order: right anterior, left anterior, right posteromedial, left posteromedial, right posterolateral, left posterolateral.1
- Push the indicator, then return under control. The reach foot starts beside the platform, off the floor, then pushes the indicator along the pole and comes back to the platform without touching the floor. The stance heel may lift.
- Record the best successful reach in each direction, read at the edge of the indicator nearest the platform.
A reach does not count if the athlete touches the floor with the reach foot, steps off the platform, kicks the indicator along, rests weight on the indicator, or cannot return to the start under control.1
Write down whether the hands were free or on the hips, and use the same choice every time. Hands free gives larger posteromedial, posterolateral and composite scores, and changed which athletes fell below the screening cut-offs in one study.6 The current protocol leaves the hands free. Our YBT Y-Balance Test Kit has a printed centimetre scale on each pole and a Quick Set-up Guide in English and Thai, with the test steps and recording sheets.
For the testing station, print our one page quick reference: how to measure limb length, a small diagram of each reach for both tests, the recording rules, what makes a reach not count, and the scoring formulas.
What Is a Good Y-Balance Test Composite Score?
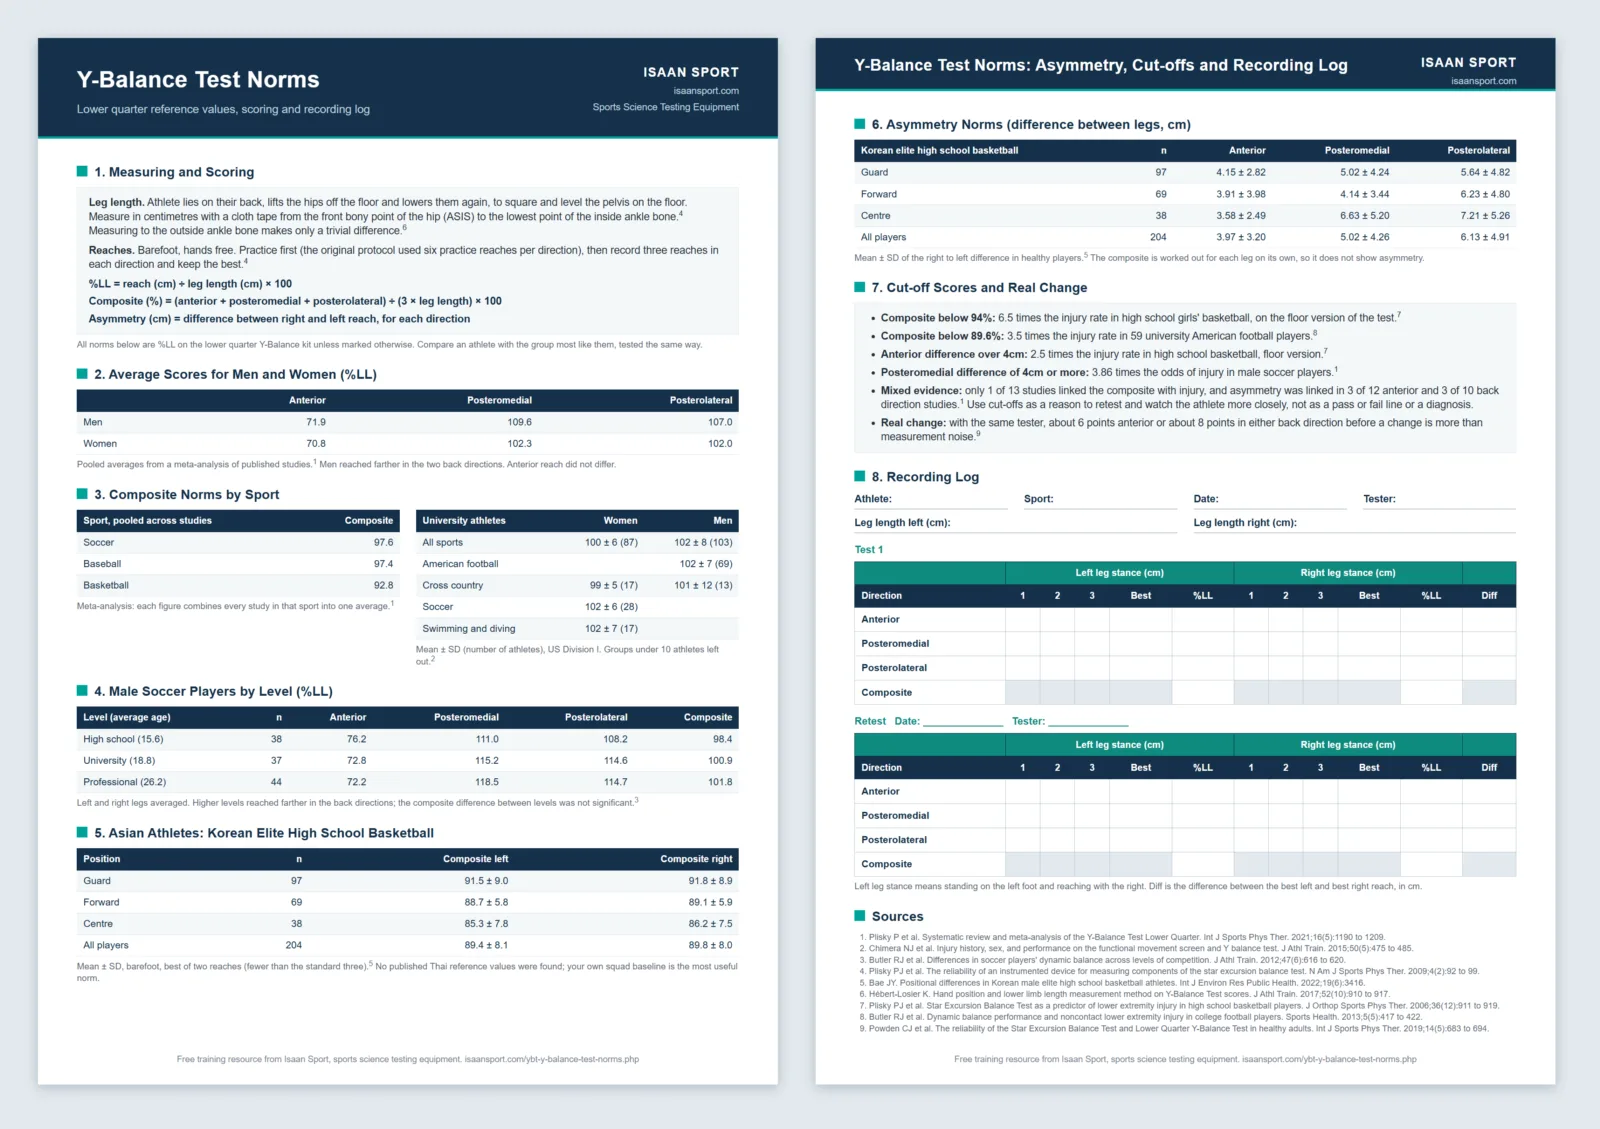
A meta-analysis of 57 studies put the pooled average composite at 95.8% of leg length for men and 95.3% for women, with no real difference between the sexes.4 Group averages ranged by up to 13 points between sports, sexes and competition levels, from about 93% in basketball players to about 98% in soccer players. Our YBT norms article sets out the published averages by sport, level and age, with the method each study used.
For most coaches, the more useful comparisons are left against right, and this season against last season for the same athlete.
What Does a 4 cm Difference Between Legs Mean?
In 235 high school basketball players, those whose right and left anterior reach differed by more than 4 cm were 2.5 times as likely to be injured during the season, and girls with a composite below 94% were 6.5 times as likely.2 That study used the floor version of the test, the Star Excursion Balance Test. A later study used the Y-Balance Test on 184 university athletes. It found more than 4 cm of anterior difference was linked with non-contact injury (odds ratio 2.33), while the composite was not; the cut-off picked out 59% of the injured athletes and cleared 72% of the uninjured ones.3
The wider evidence is mixed. In the 2021 meta-analysis, only 3 of the 13 studies that looked at anterior difference found it linked with injury, and the authors concluded that general cut points, not set for a particular sport and level, may not predict injury.4 Treat a flag as a reason to retest and watch that athlete, not as a prediction.
The two back directions have less support. In the same meta-analysis, 3 of 10 studies linked a posteromedial or posterolateral difference with injury. Male soccer players with a posteromedial difference of 4 cm or more had 3.86 times the odds of injury, but four other studies using the same 4 cm cut-off found no link.4 Differences of this size are also common in healthy athletes: in 204 Korean male elite high school basketball players, the average right to left difference was 4.0 cm anterior, 5.0 cm posteromedial and 6.1 cm posterolateral.9 The calculator shows a back direction difference of 4 cm or more so you can check the entries and retest, not as a warning on its own.
How Big a Change Is a Real Change?
When the same tester repeats the test, the smallest change that is more than measurement noise averages about 6 percentage points for anterior reach, 8 for posteromedial and 8 for posterolateral, pooled from the reliability studies.5 In centimetres, that is about 6 cm, 7 cm and 9 cm. A two point rise in one direction between tests is within the noise. Reliability is good overall: the same tester gets close to the same score on repeat tests, with intraclass correlations of about 0.85 to 0.91.4,5
Should I use the best or the average of three reaches?
The original protocol and this calculator use the best successful reach.1 Some studies average the three, which gives slightly lower numbers. Either is fine for tracking an athlete, provided the same method is used each time. When comparing with published norms, use the method the study used.
Can I use this calculator for the upper quarter Y-Balance Test?
Yes. Choose the upper body test above the inputs. The arithmetic is the same, with arm length in place of leg length, measured from the bony bump at the base of the neck (C7) to the tip of the longest finger with the arm out to the side at shoulder height.8 The directions are medial, inferolateral and superolateral, right and left name the hand on the platform, and averages are lower, about 80 to 82% for active adults.7 Our YBT norms article has more upper body figures.
Is the Y-Balance Test the same as the Star Excursion Balance Test?
No. The Y-Balance Test grew out of the Star Excursion Balance Test, but anterior reach comes out lower on the Y-Balance kit, so scores and cut-offs from one should not be applied to the other.
Related Reading
- YBT norms, average scores by sport, level, sex and age.
- Y-Balance Test recording sheets, free printables for one athlete or a squad, with a one page quick reference.
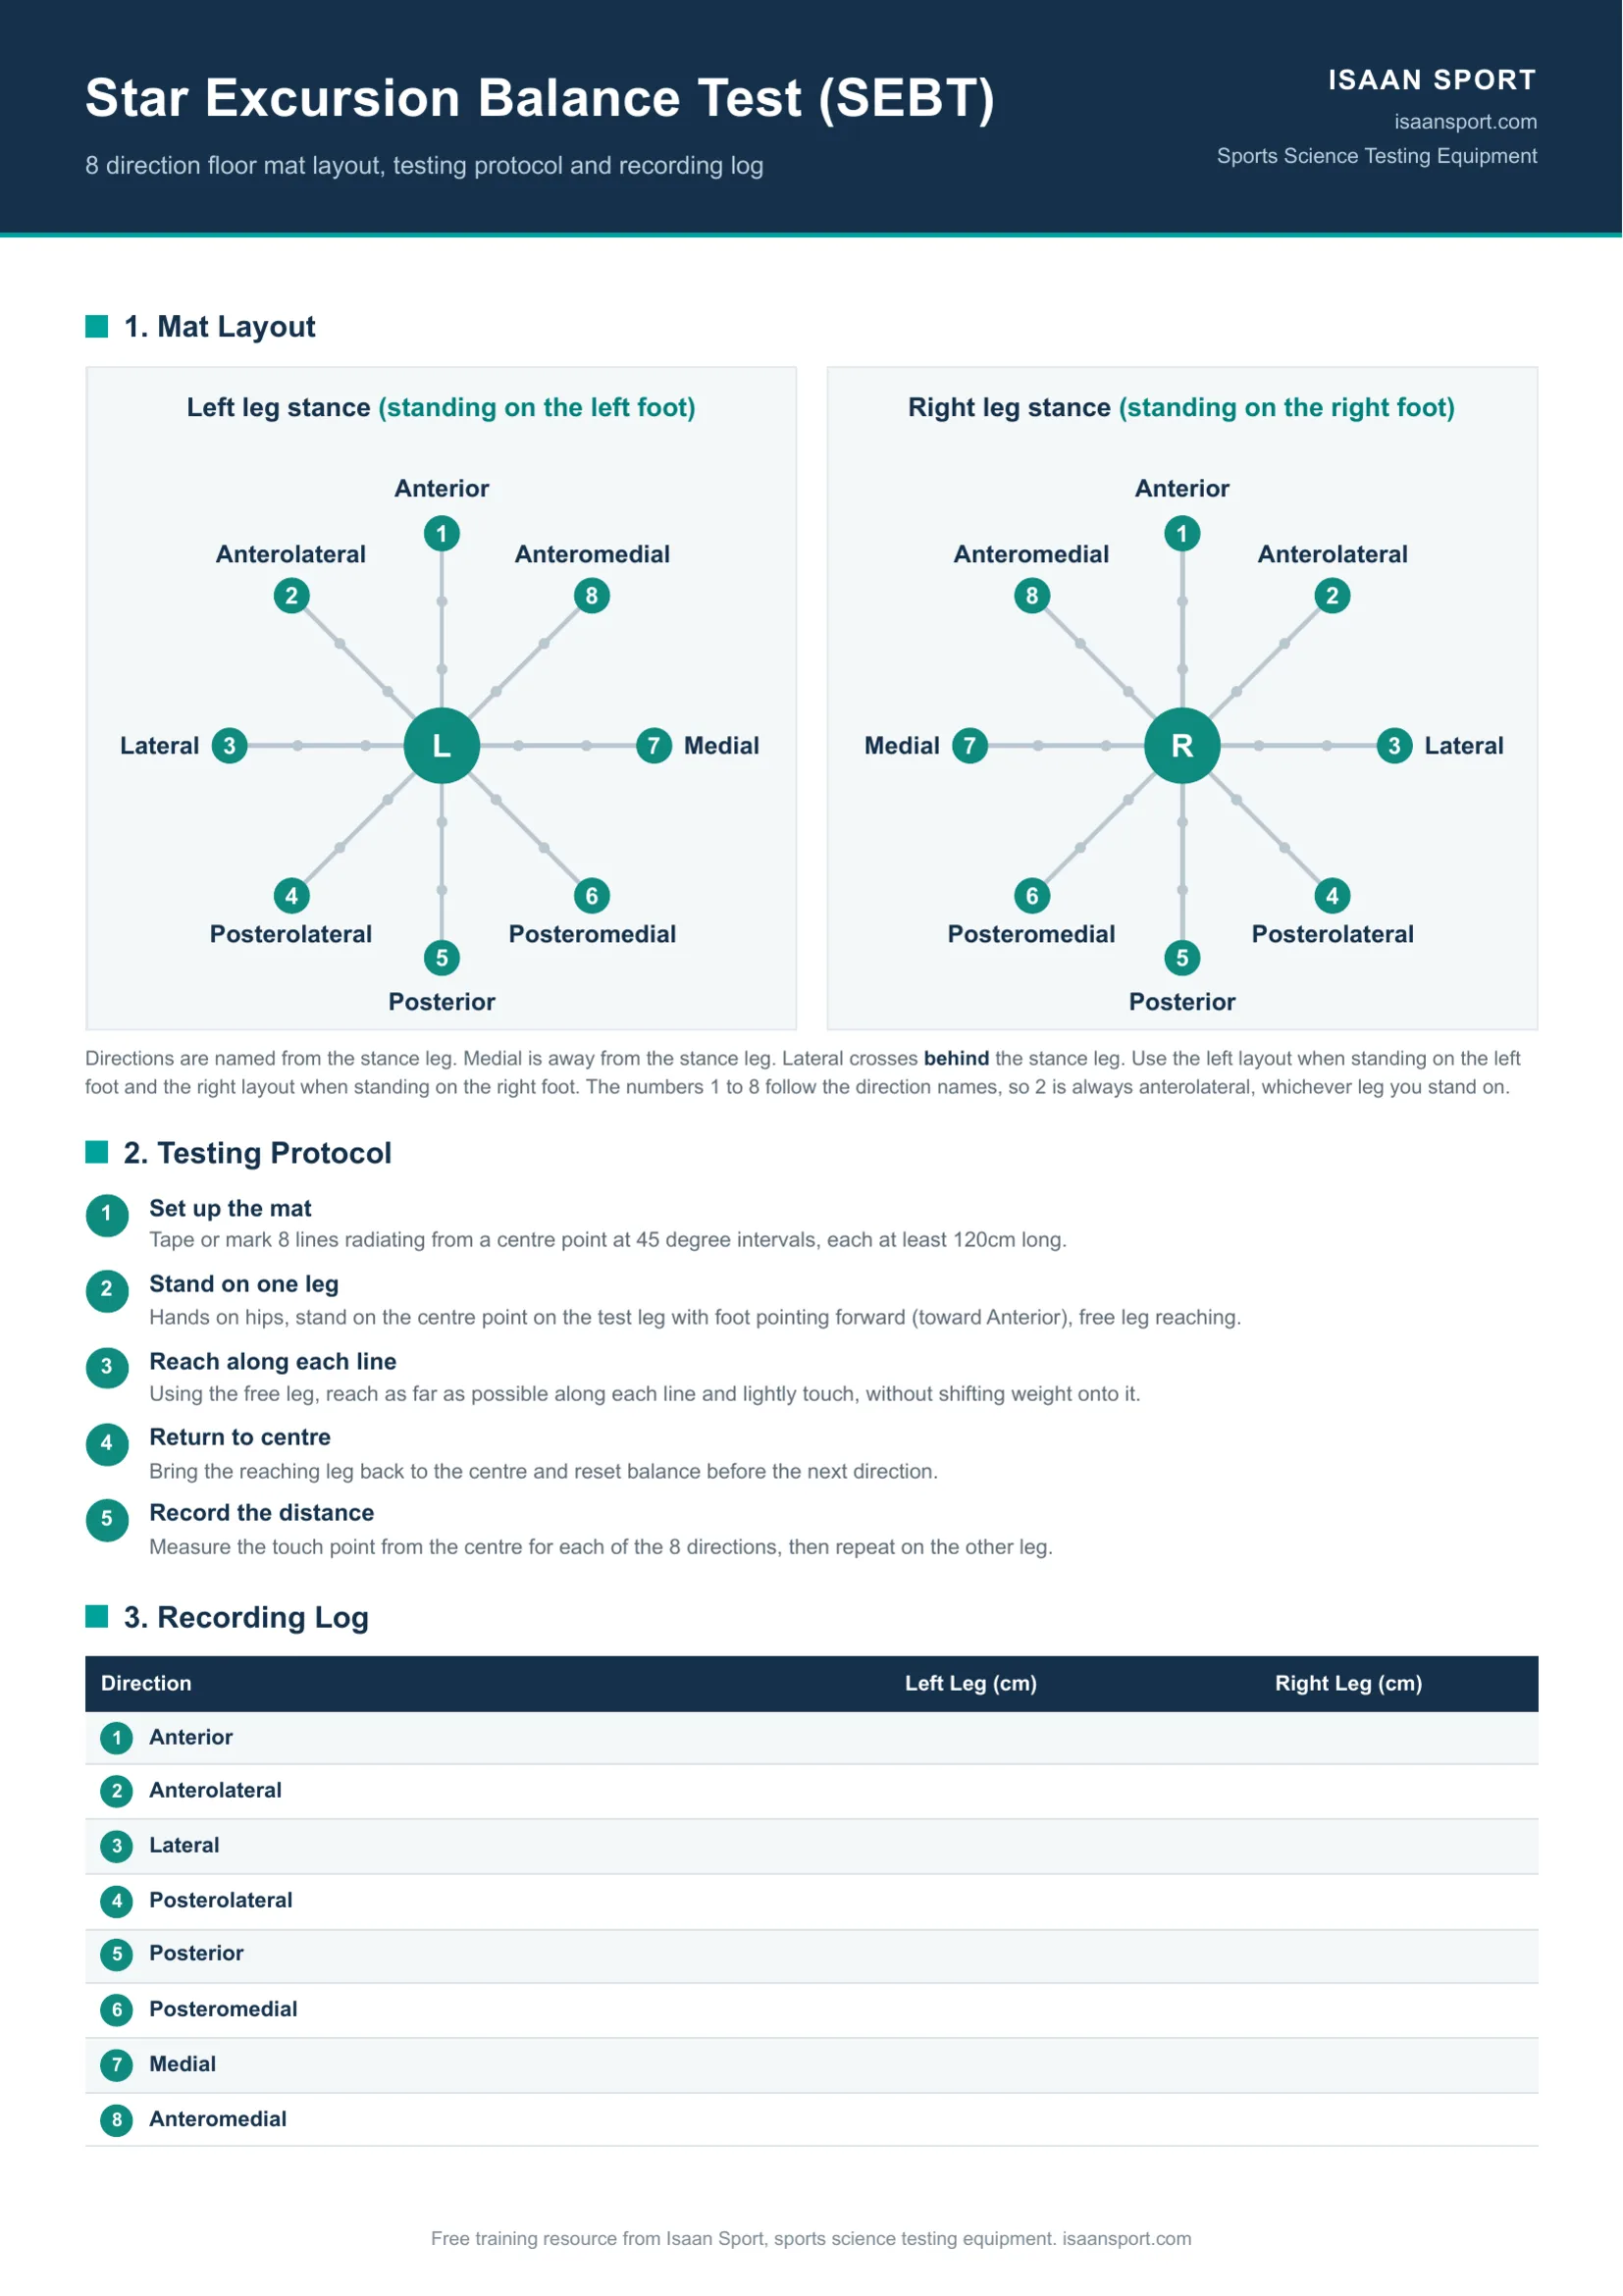
- Star Excursion Balance Test diagram, a free printable for the eight direction floor test.
- YBT Y-Balance Test Kit, the stance platform, poles and reach indicators.
References
- Plisky PJ, Gorman PP, Butler RJ, Kiesel KB, Underwood FB, Elkins B. The reliability of an instrumented device for measuring components of the star excursion balance test. North American Journal of Sports Physical Therapy. 2009;4(2):92 to 99. PubMed 21509114
- Plisky PJ, Rauh MJ, Kaminski TW, Underwood FB. Star Excursion Balance Test as a predictor of lower extremity injury in high school basketball players. Journal of Orthopaedic and Sports Physical Therapy. 2006;36(12):911 to 919. doi:10.2519/jospt.2006.2244
- Smith CA, Chimera NJ, Warren M. Association of Y balance test reach asymmetry and injury in division I athletes. Medicine and Science in Sports and Exercise. 2015;47(1):136 to 141. doi:10.1249/MSS.0000000000000380
- Plisky P, Schwartkopf-Phifer K, Huebner B, Garner MB, Bullock G. Systematic review and meta-analysis of the Y-Balance Test Lower Quarter: reliability, discriminant validity, and predictive validity. International Journal of Sports Physical Therapy. 2021;16(5):1190 to 1209. doi:10.26603/001c.27634
- Powden CJ, Dodds TK, Gabriel EH. The reliability of the Star Excursion Balance Test and Lower Quarter Y-Balance Test in healthy adults: a systematic review. International Journal of Sports Physical Therapy. 2019;14(5):683 to 694. PubMed 31598406
- Hébert-Losier K. Clinical implications of hand position and lower limb length measurement method on Y-Balance Test scores and interpretations. Journal of Athletic Training. 2017;52(10):910 to 917. doi:10.4085/1062-6050-52.8.02
- Gorman PP, Butler RJ, Plisky PJ, Kiesel KB. Upper Quarter Y Balance Test: reliability and performance comparison between genders in active adults. Journal of Strength and Conditioning Research. 2012;26(11):3043 to 3048. doi:10.1519/JSC.0b013e3182472fdb
- Westrick RB, Miller JM, Carow SD, Gerber JP. Exploration of the Y-balance test for assessment of upper quarter closed kinetic chain performance. International Journal of Sports Physical Therapy. 2012;7(2):139 to 147. PubMed 22530188
- Bae JY. Positional differences in physique, physical strength, and lower extremity stability in Korean male elite high school basketball athletes. International Journal of Environmental Research and Public Health. 2022;19(6):3416. doi:10.3390/ijerph19063416
Dr Wannaporn Sumranpat Brady is a physiotherapist with a PhD, not a medical doctor, and a lecturer in the Department of Health Science and Sports at Mahasarakham University's Faculty of Education. Her research is on patellofemoral pain (PFP). She holds a PhD in Exercise and Sport Science from Mahasarakham University, an MSc in Physical Therapy from Khon Kaen University and a BSc in Physical Therapy from Naresuan University, and has also published on athletic injury rehabilitation, sports biomechanics and physical training programme design. She co-founded Isaan Sport Technology and writes its sports science articles, which take their figures from journal studies and from tests on the equipment the store sells.