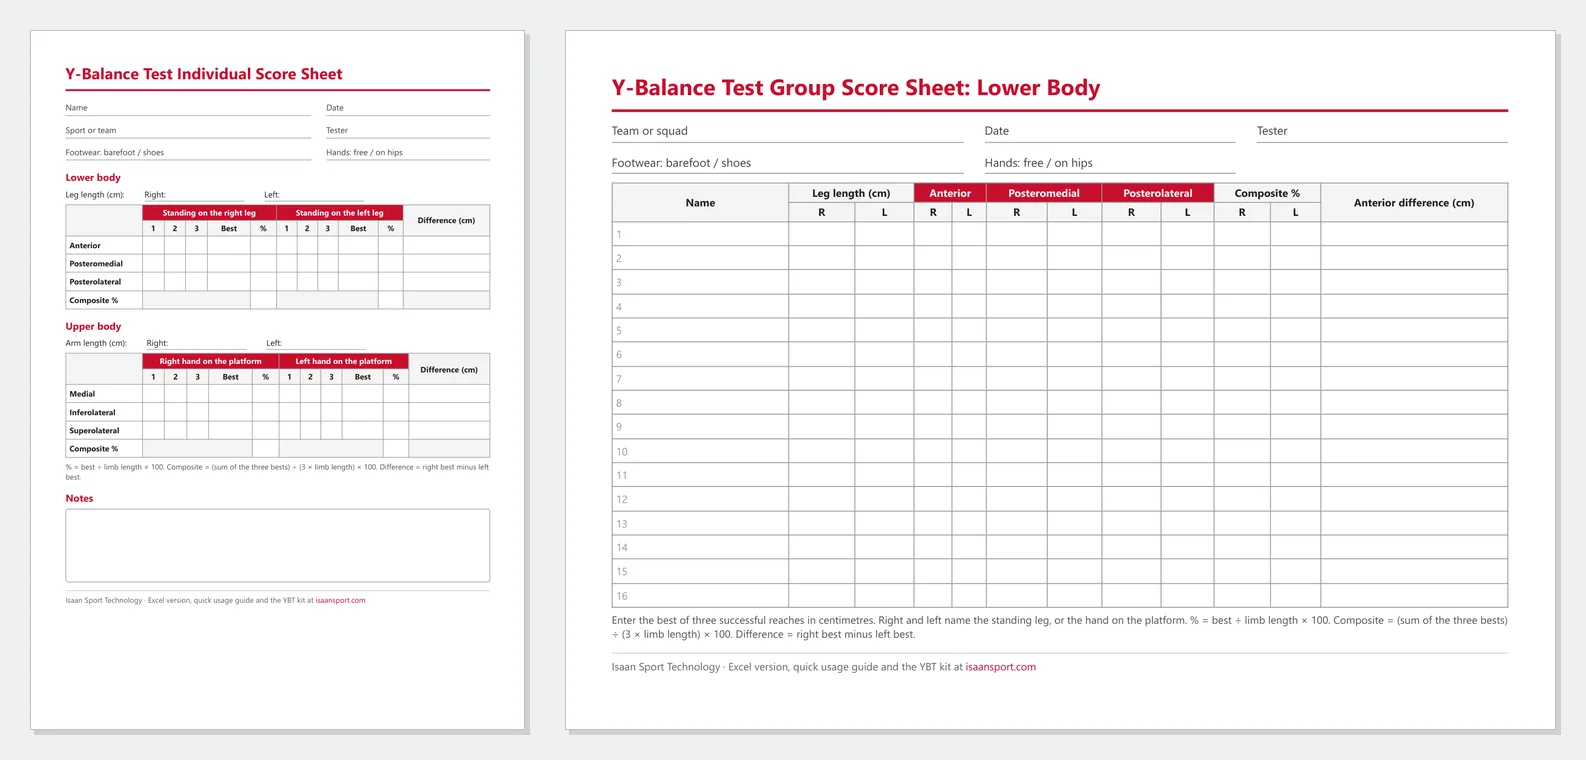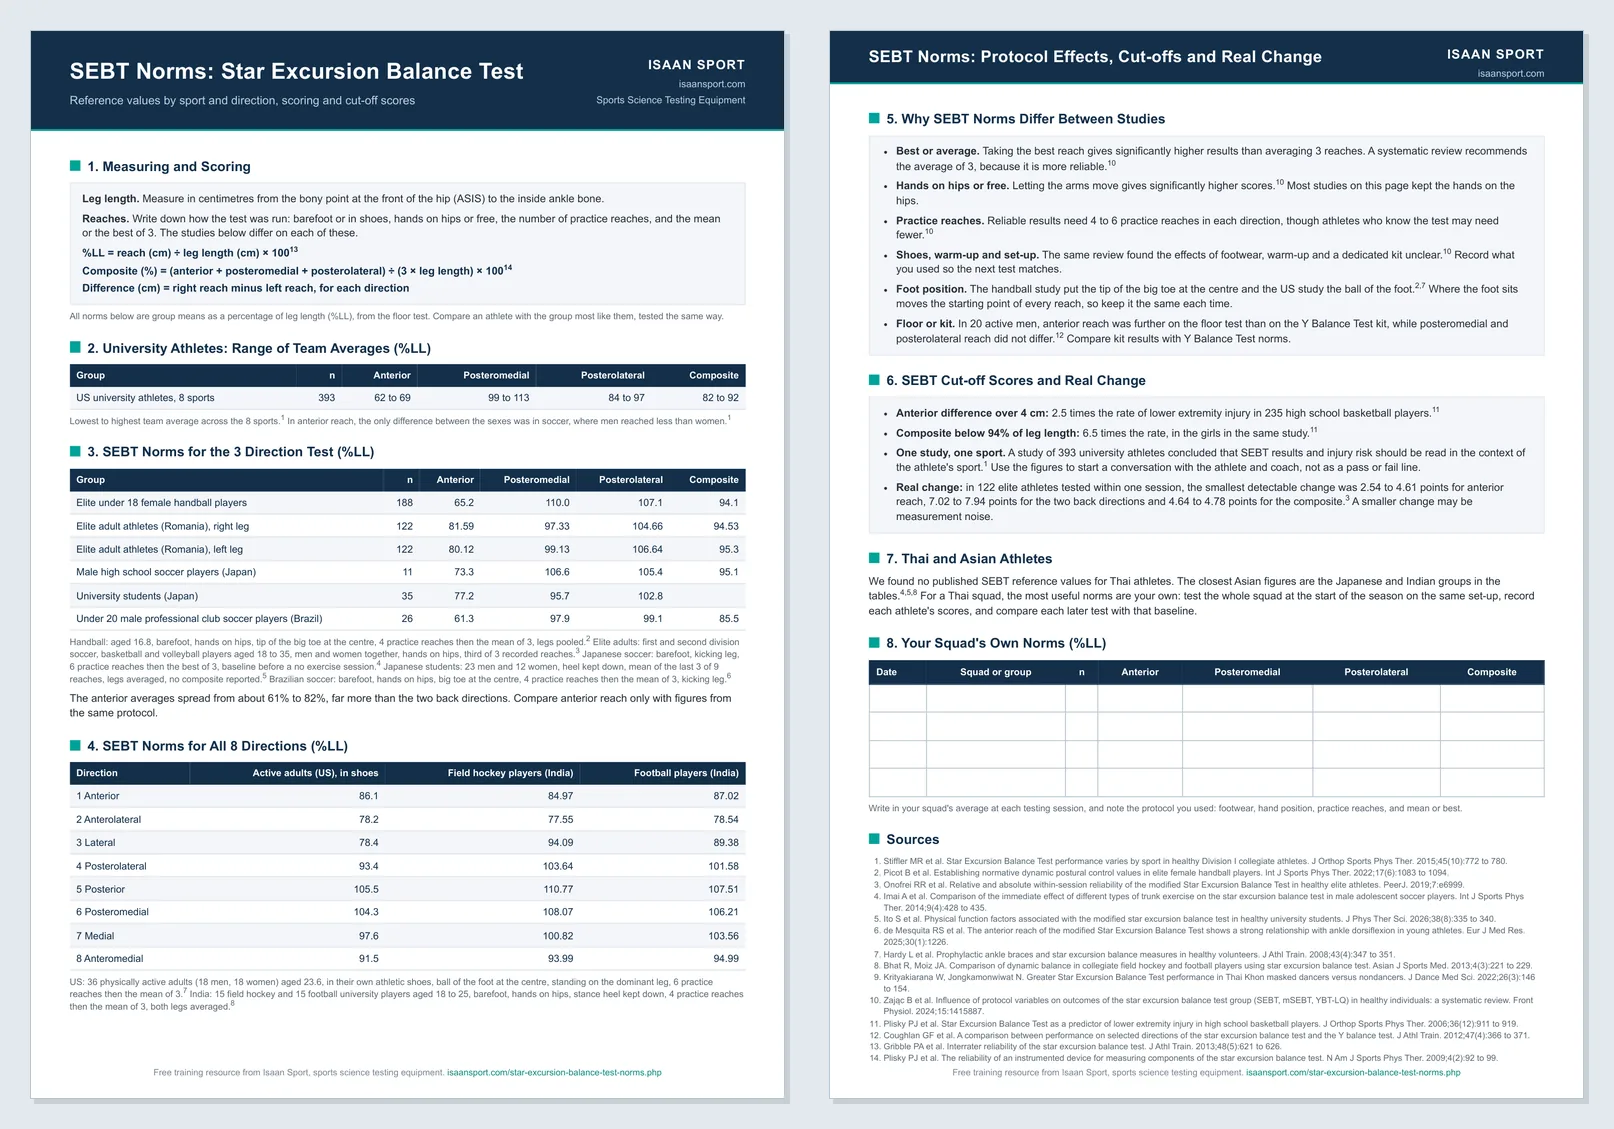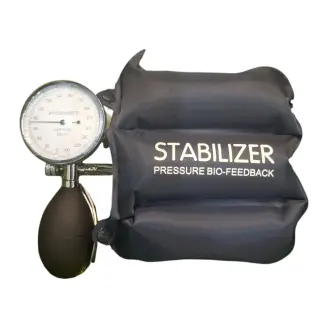
SEBT Individual Score Sheet
Use this sheet when you want one athlete's whole result on a single page, for a first test, a retest, or the athlete's file. You write down all three recorded reaches in each direction for each leg, so the page shows how consistent the reaches were as well as the score. It then takes you from the score to the reach as a percentage of leg length, the right minus left difference in each direction, and a composite for each leg, which are the figures you compare with an earlier test or with published norms. The direction diagrams for each leg are printed on the page, and the lines at the top record leg length, footwear, and whether you scored the mean or the best reach, so the next test can be run the same way.
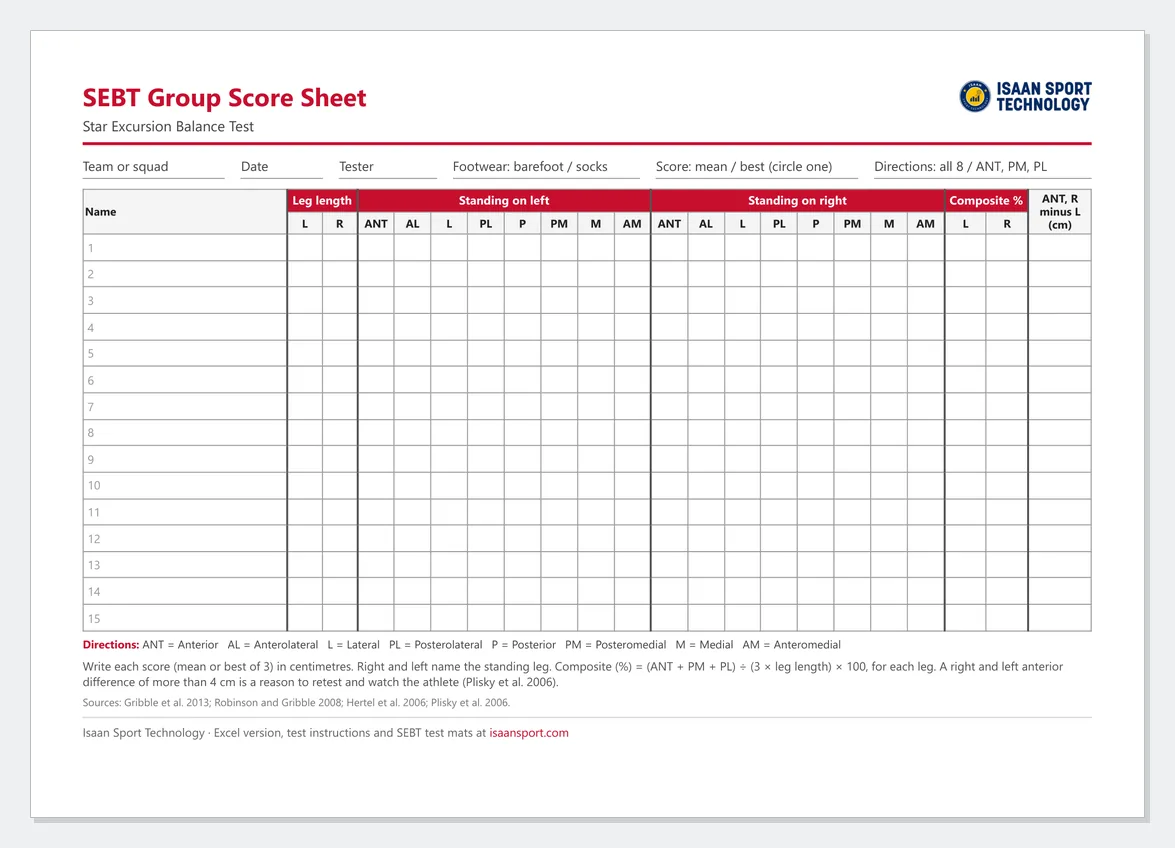
SEBT Group Score Sheet
Use this sheet when you test a squad or a class in one session and want everyone side by side on one page. Each of the 15 rows has space for 1 score per direction per athlete for each leg, so record the mean or best reach as you go. The composite for each leg and the right minus left difference in anterior reach are in the same row, so you can run down the page and see who to retest or look at more closely. The columns use short direction names, with the full names in a key under the table. For the three direction version, fill in ANT, PM and PL and leave the other columns blank.
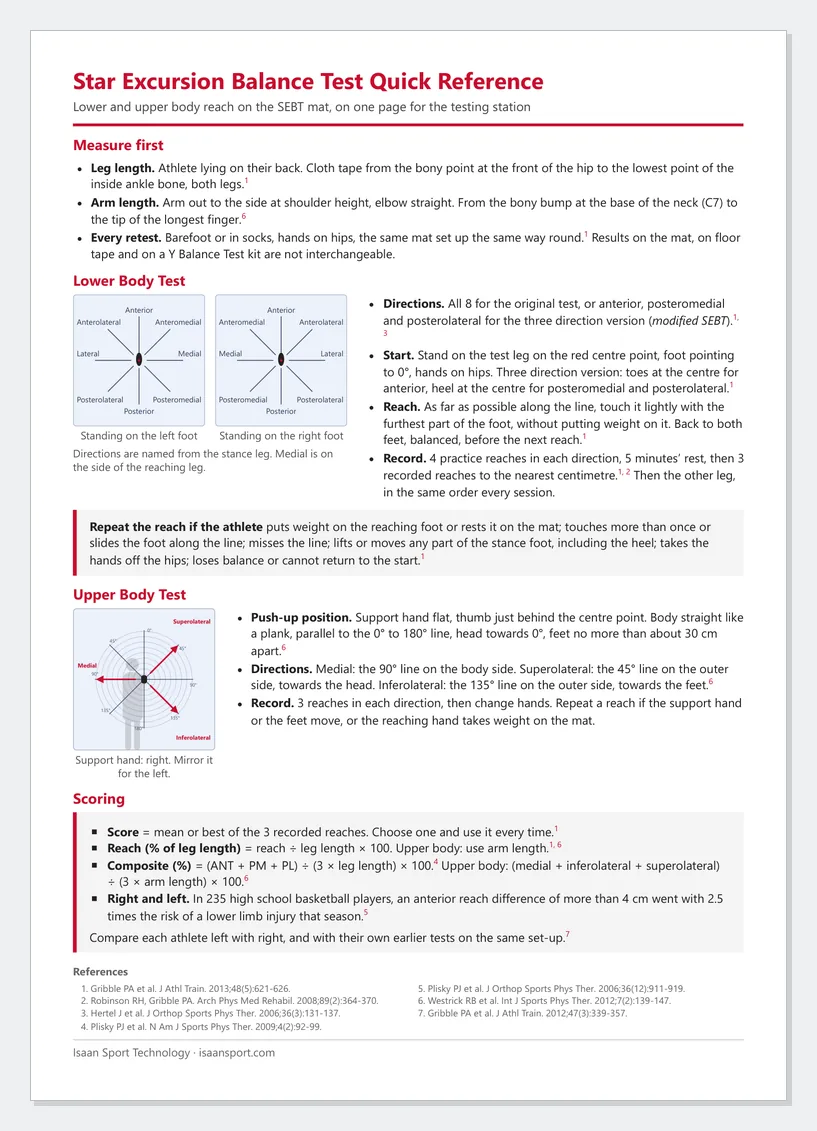
SEBT Quick Reference (1 Page)
The test on a single portrait page to print with the sheets: how to measure leg and arm length, the direction diagrams, the start position for the three direction version, what makes a reach not count, and the scoring formulas. It also shows an upper body reach in push-up position along the same lines.
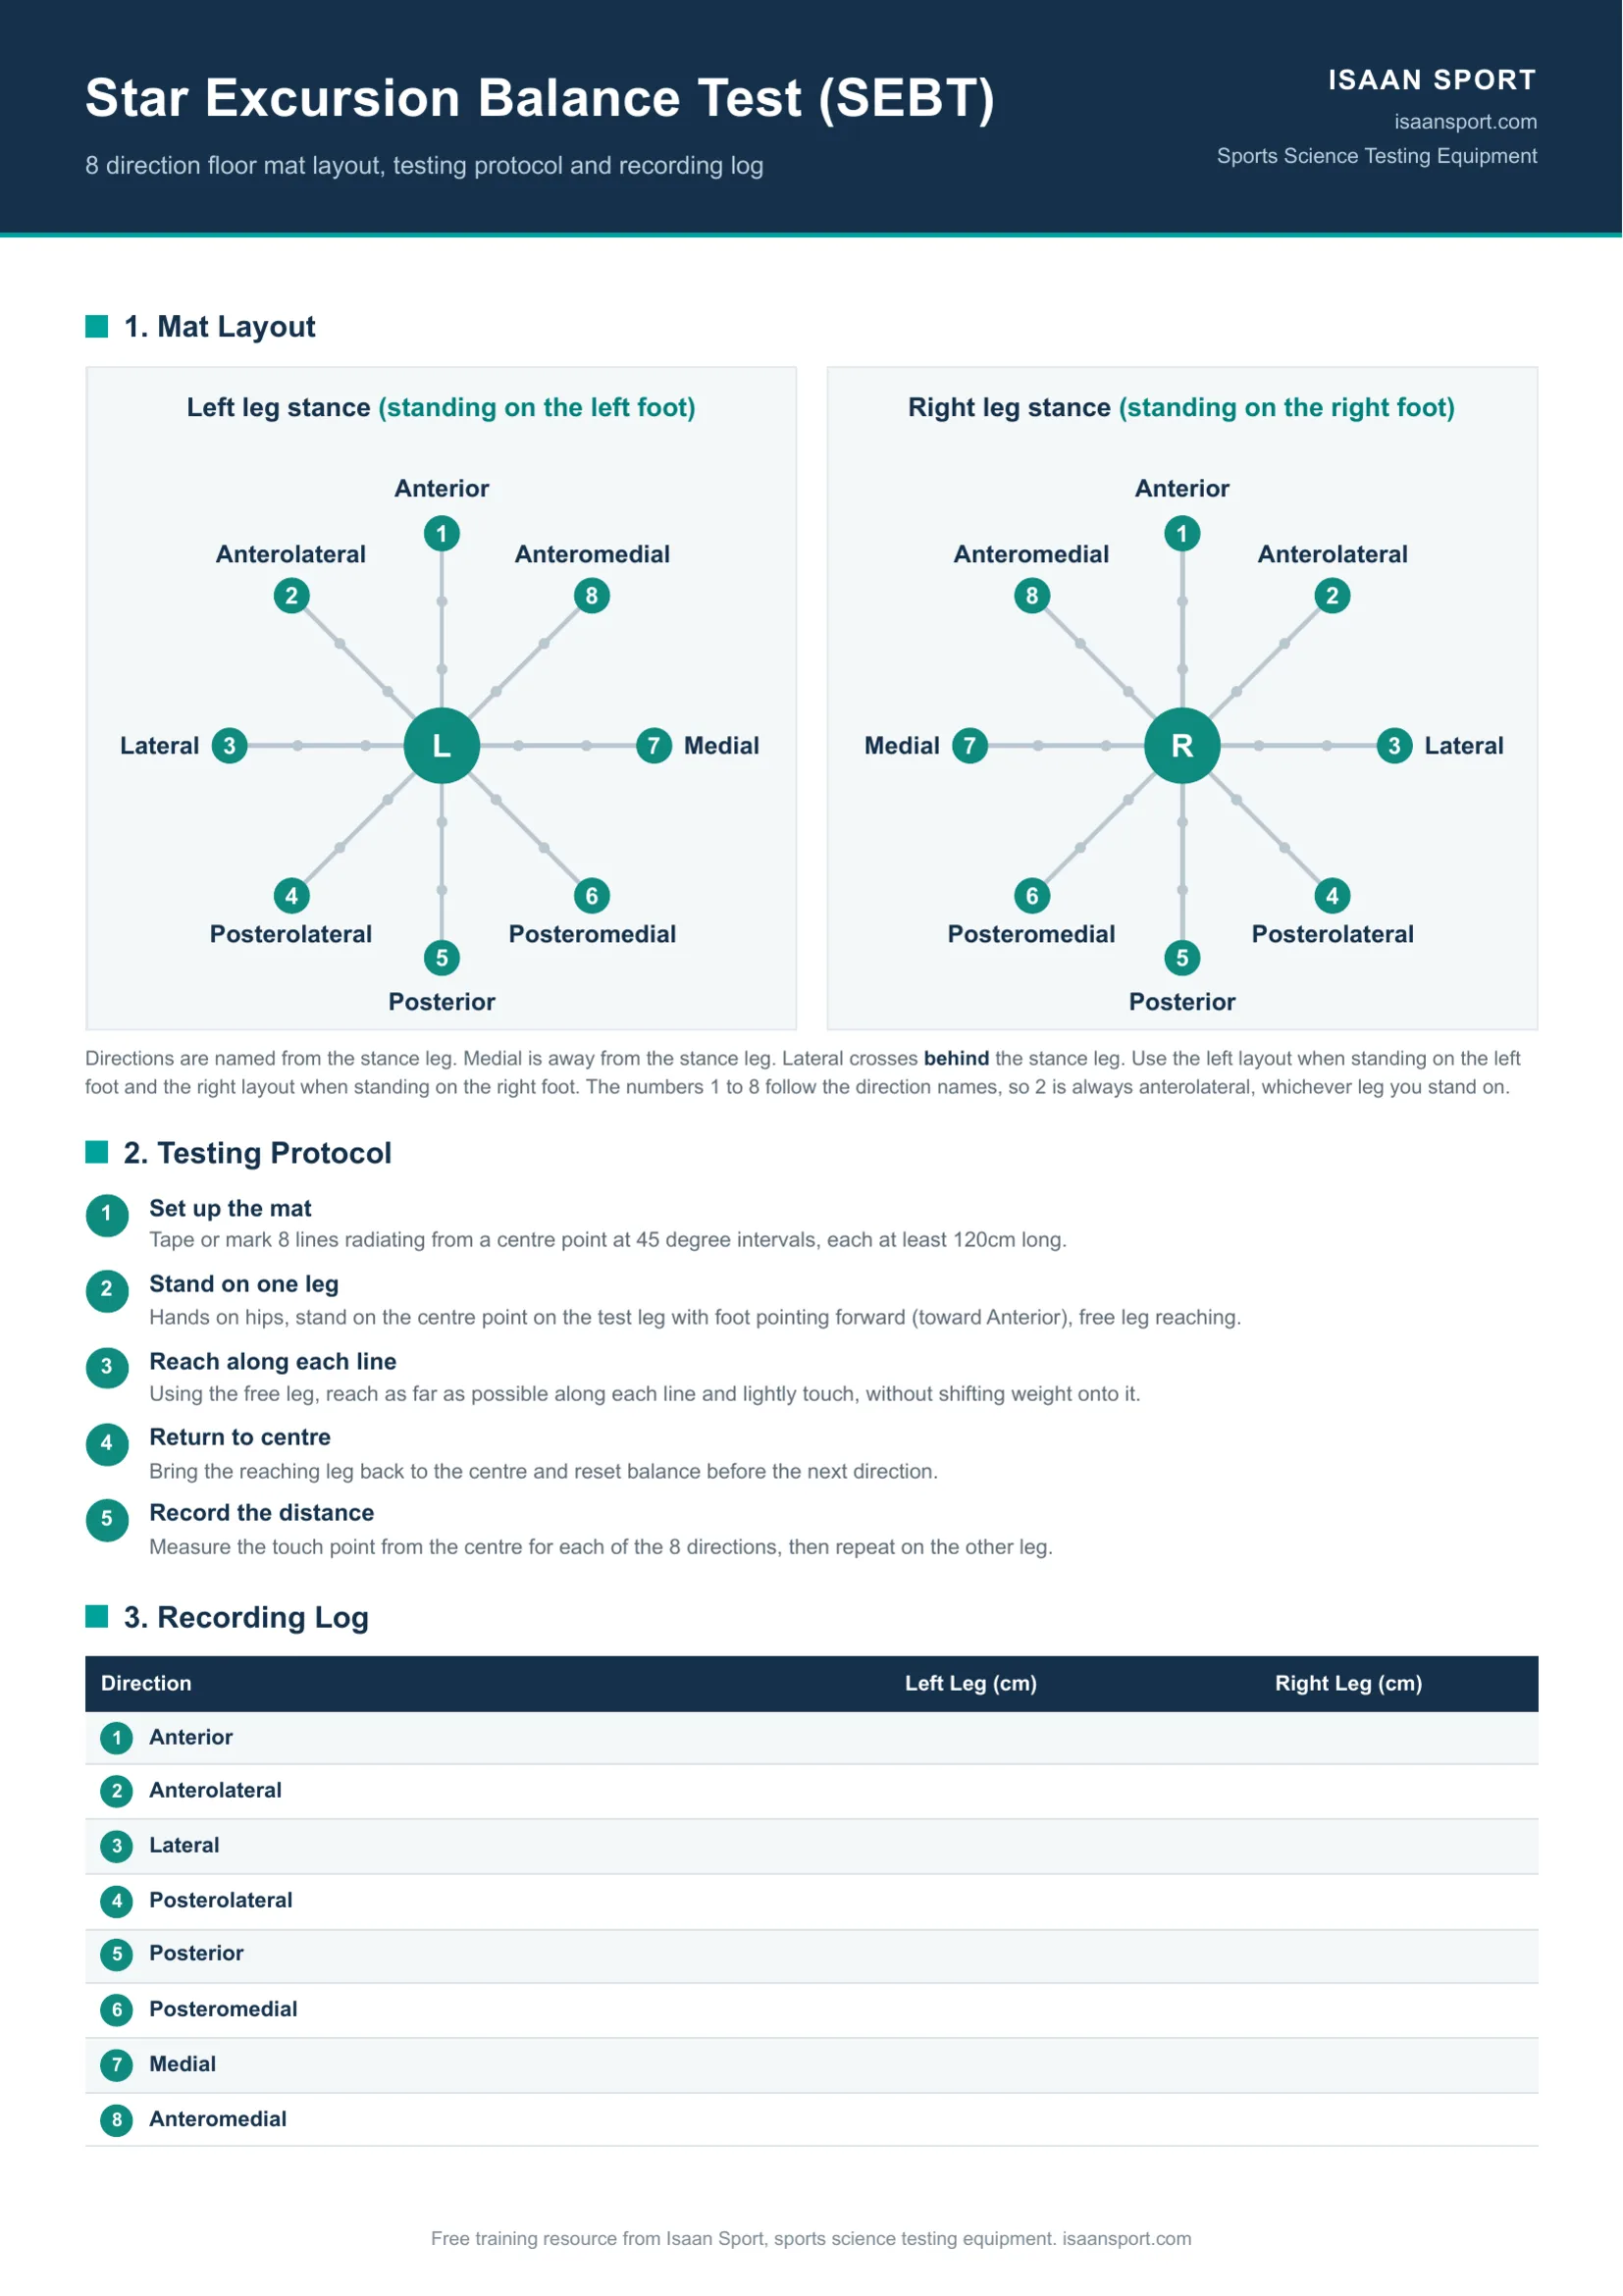
SEBT Direction Numbers
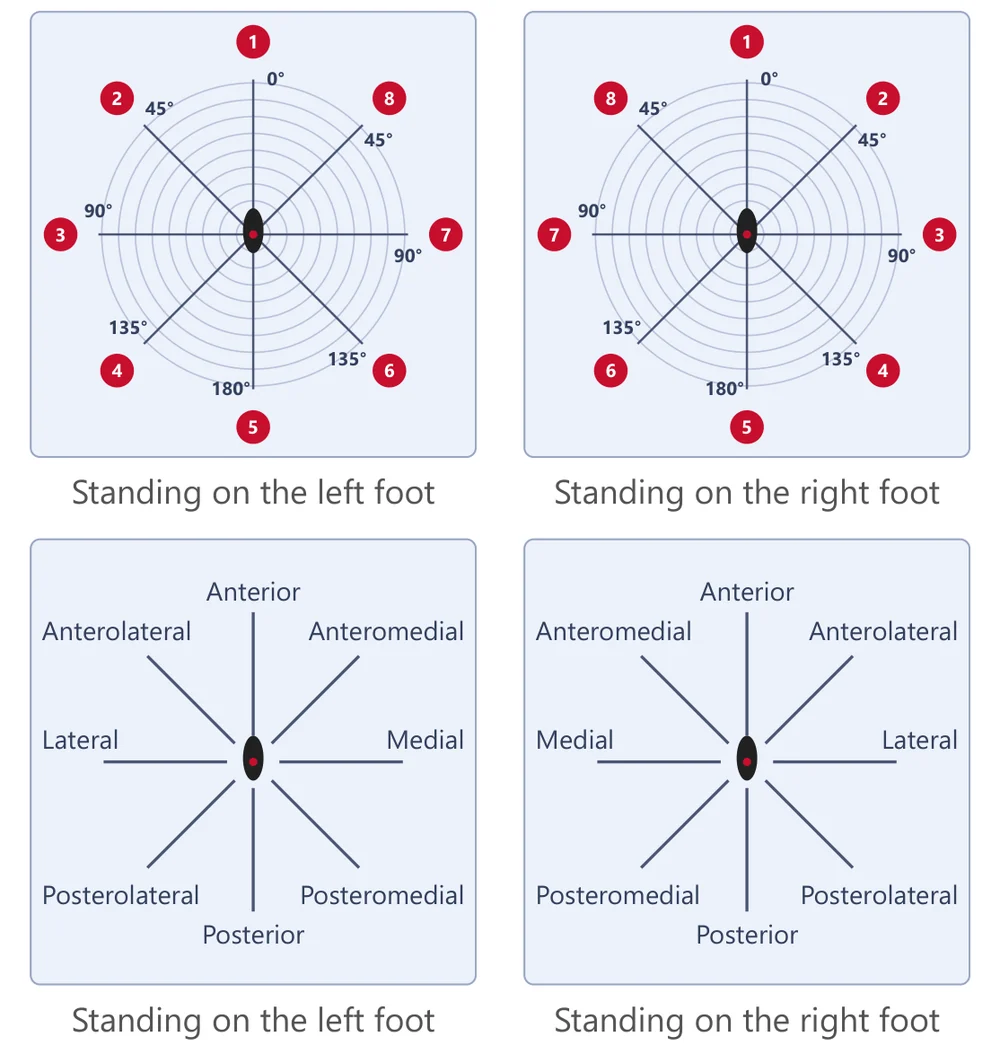
The sheets number the directions 1 to 8, and each direction is named from the standing leg. Medial is on the side of the reaching leg, and lateral reaches cross past the standing leg, so the same number sits on the other side of the mat when the athlete changes legs. Keep this diagram next to the scorer for the first few sessions.
Using the SEBT Score Sheets With a Test Mat
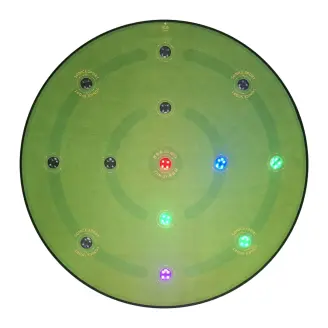
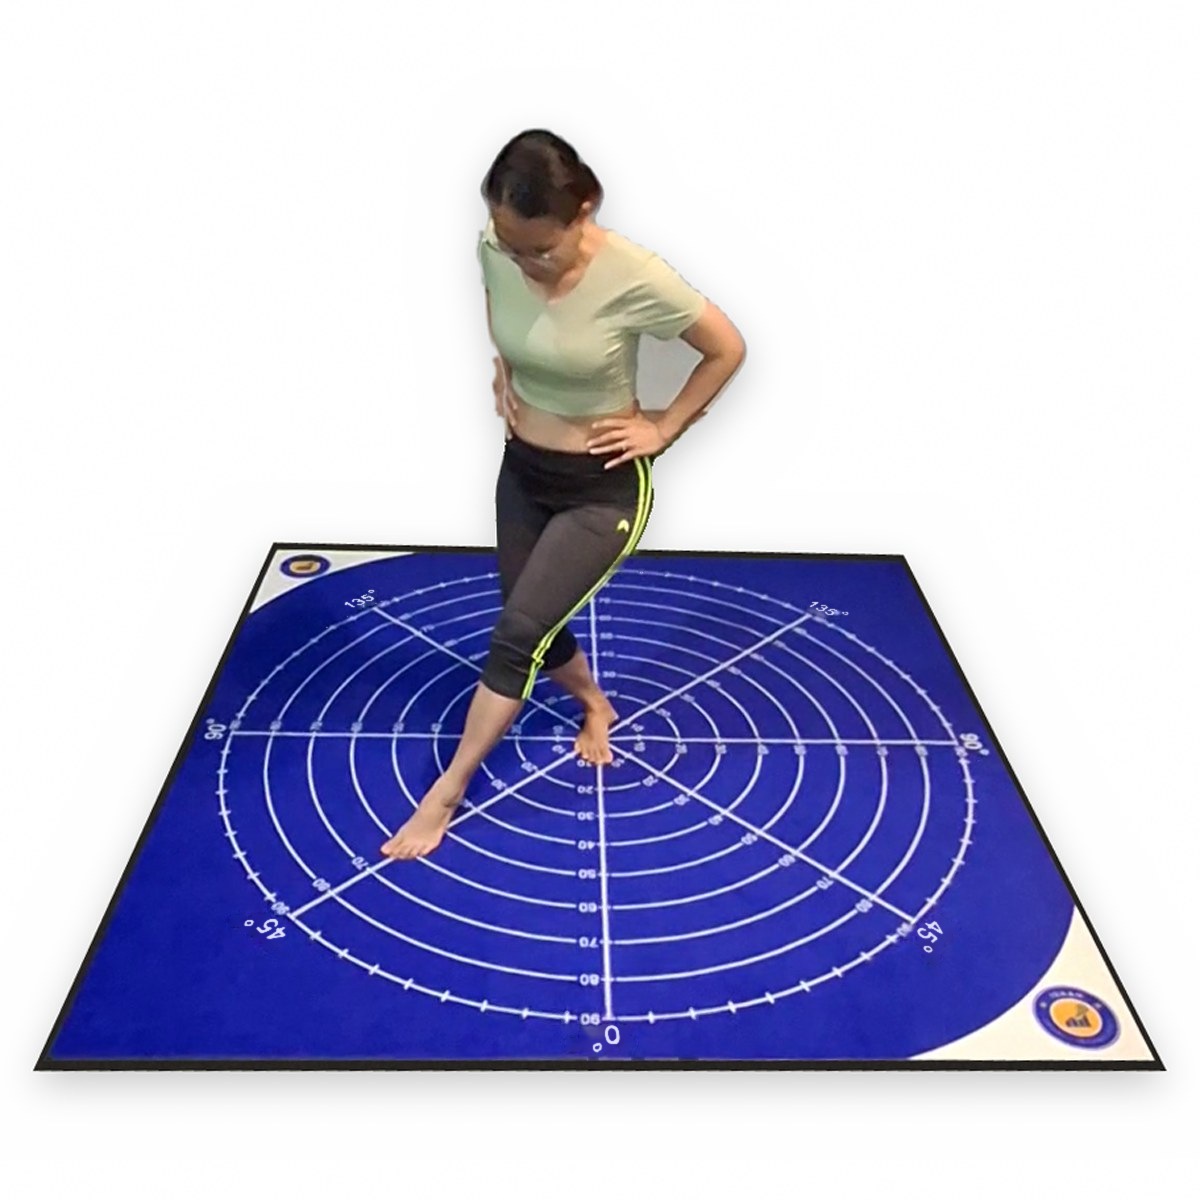
The sheets work the same on tape lines or on a printed mat. Our SEBT mats have the eight reach lines printed from a centre point at 45 degree intervals, with distance rings every 10 cm out to 90 cm, so there is nothing to tape out or measure before a session and the layout is the same every time. Both mats are 200 x 200 cm. The anti-slip rubber backed nylon mat is firm underfoot and sits solidly in place, and the soft velvet carpet mat is lightweight and easy to move around. The lines on the mat are labelled by angle, not by number, so keep the direction diagram above next to the scorer to match each line to its number on the sheet. The quick reference above is the same page as in each mat's manual.
How to Fill In the SEBT Score Sheets
- Leg length first. With the athlete lying on their back, measure each leg with a cloth tape from the bony point at the front of the hip (ASIS) to the lowest point of the inside ankle bone, and write both on the sheet.1
- Right and left. Right and left name the standing leg. The sheets put the left leg first, so test it first and keep that order at every session.
- Footwear and hands. Circle barefoot or socks. Hands stay on the hips throughout.1
- Practice, then record. Give 4 practice reaches in each direction, then 5 minutes' rest, then write down 3 recorded reaches to the nearest centimetre.1,2
- All 8 or three directions. Circle all 8 for the original test, or ANT, PM and PL for the three direction version (modified SEBT).1,3
- Successful reaches only. A reach does not count if the athlete puts weight on the reaching foot, touches more than once, misses the line, moves the stance foot, takes the hands off the hips or loses balance. Repeat it, and write down the three that do count.1
SEBT Scoring Formulas
- Score = the mean or the best of the 3 recorded reaches, in centimetres. Circle which one you use and keep to it.
- Reach % = score ÷ leg length × 1001
- Composite % = (ANT + PM + PL) ÷ (3 × leg length) × 100, for each leg4
- Difference = right score minus left score, in centimetres, for each direction
An example: an athlete with an 88 cm left leg whose mean reaches standing on the left leg are 67 cm anterior, 86 cm posteromedial and 79 cm posterolateral has an anterior reach of 67 ÷ 88 × 100 = 76.1%, and a composite of (67 + 86 + 79) ÷ (3 × 88) × 100 = 87.9%. If their right anterior score is 62 cm, the difference is 62 minus 67 = −5 cm.
In 235 high school basketball players, those whose right and left anterior reach differed by more than 4 cm were 2.5 times more likely to have a lower limb injury that season.5 Treat a large difference as a reason to retest and watch the athlete, not as a diagnosis, and compare each athlete with their own earlier tests on the same set-up.6 For published averages by sport, see SEBT norms.
The Excel files do these sums for you. Choose mean or best in the Score box, type the reaches in the white boxes, and the grey boxes fill in the scores. A right minus left difference of more than 4 cm turns red.
Common Questions
Should I record the mean or the best reach?
Either works, as long as you use the same one every time and circle it on the sheet. Published studies of the test report the mean or the best of the 3 recorded reaches,1,6 and the mean is never higher than the best, so switching between them makes an athlete look better or worse than they are. The Excel files have a Score box where you choose, and every score follows it.
Do I need to test all 8 directions?
No, the three direction version (modified SEBT) uses anterior, posteromedial and posterolateral, and both sheets cover it. In young adults with and without chronic ankle instability, posteromedial reach was the most representative of all 8 directions, and the directions overlapped considerably.3 Circle the version at the top of the sheet, leave the other rows blank, and use the same version at every retest.
Can I compare these scores with Y-Balance Test kit scores?
Not for anterior reach. In 20 active men, anterior reach was further on the floor test than on the Y-Balance Test kit, while posteromedial and posterolateral reach did not differ.7 Keep floor or mat scores and kit scores in separate records, and retest each athlete on the same set-up. For the kit, use the YBT score sheets, which follow its three directions.
Related Reading
- Star Excursion Balance Test instructions, a free printable for marking out the floor test.
- SEBT norms, published reach scores by sport and direction.
- Y-Balance Test score sheets, for the lower and upper body tests on the kit.
References
- Gribble PA, Kelly SE, Refshauge KM, Hiller CE. Interrater reliability of the star excursion balance test. Journal of Athletic Training. 2013;48(5):621 to 626. PubMed 24067151
- Robinson RH, Gribble PA. Support for a reduction in the number of trials needed for the star excursion balance test. Archives of Physical Medicine and Rehabilitation. 2008;89(2):364 to 370. PubMed 18226664
- Hertel J, Braham RA, Hale SA, Olmsted-Kramer LC. Simplifying the star excursion balance test: analyses of subjects with and without chronic ankle instability. Journal of Orthopaedic and Sports Physical Therapy. 2006;36(3):131 to 137. PubMed 16596889
- Plisky PJ, Gorman PP, Butler RJ, Kiesel KB, Underwood FB, Elkins B. The reliability of an instrumented device for measuring components of the star excursion balance test. North American Journal of Sports Physical Therapy. 2009;4(2):92 to 99. PubMed 21509114
- Plisky PJ, Rauh MJ, Kaminski TW, Underwood FB. Star Excursion Balance Test as a predictor of lower extremity injury in high school basketball players. Journal of Orthopaedic and Sports Physical Therapy. 2006;36(12):911 to 919. PubMed 17193868
- Gribble PA, Hertel J, Plisky P. Using the Star Excursion Balance Test to assess dynamic postural-control deficits and outcomes in lower extremity injury: a literature and systematic review. Journal of Athletic Training. 2012;47(3):339 to 357. PubMed 22892416
- Coughlan GF, Fullam K, Delahunt E, Gissane C, Caulfield BM. A comparison between performance on selected directions of the star excursion balance test and the Y balance test. Journal of Athletic Training. 2012;47(4):366 to 371. doi:10.4085/1062-6050-47.4.03
Dr Wannaporn Sumranpat Brady is a physiotherapist with a PhD, not a medical doctor, and a lecturer in the Department of Health Science and Sports at Mahasarakham University's Faculty of Education. Her research is on patellofemoral pain (PFP). She holds a PhD in Exercise and Sport Science from Mahasarakham University, an MSc in Physical Therapy from Khon Kaen University and a BSc in Physical Therapy from Naresuan University, and has also published on athletic injury rehabilitation, sports biomechanics and physical training programme design. She co-founded Isaan Sport Technology and writes its sports science articles, which take their figures from journal studies and from tests on the equipment the store sells.