A vertical jump height means very little without the test that produced it. Professional basketball players in the Spanish ACB average about 39cm on a force plate with their hands on their hips.1 Players drafted into the NBA average 77.4cm in the standing jump at the Draft Combine, a jump with a full arm swing.11 Those are different athletes, but nothing like that whole gap is talent. One test keeps the arms out of it, the other lets them add as much height as they can.
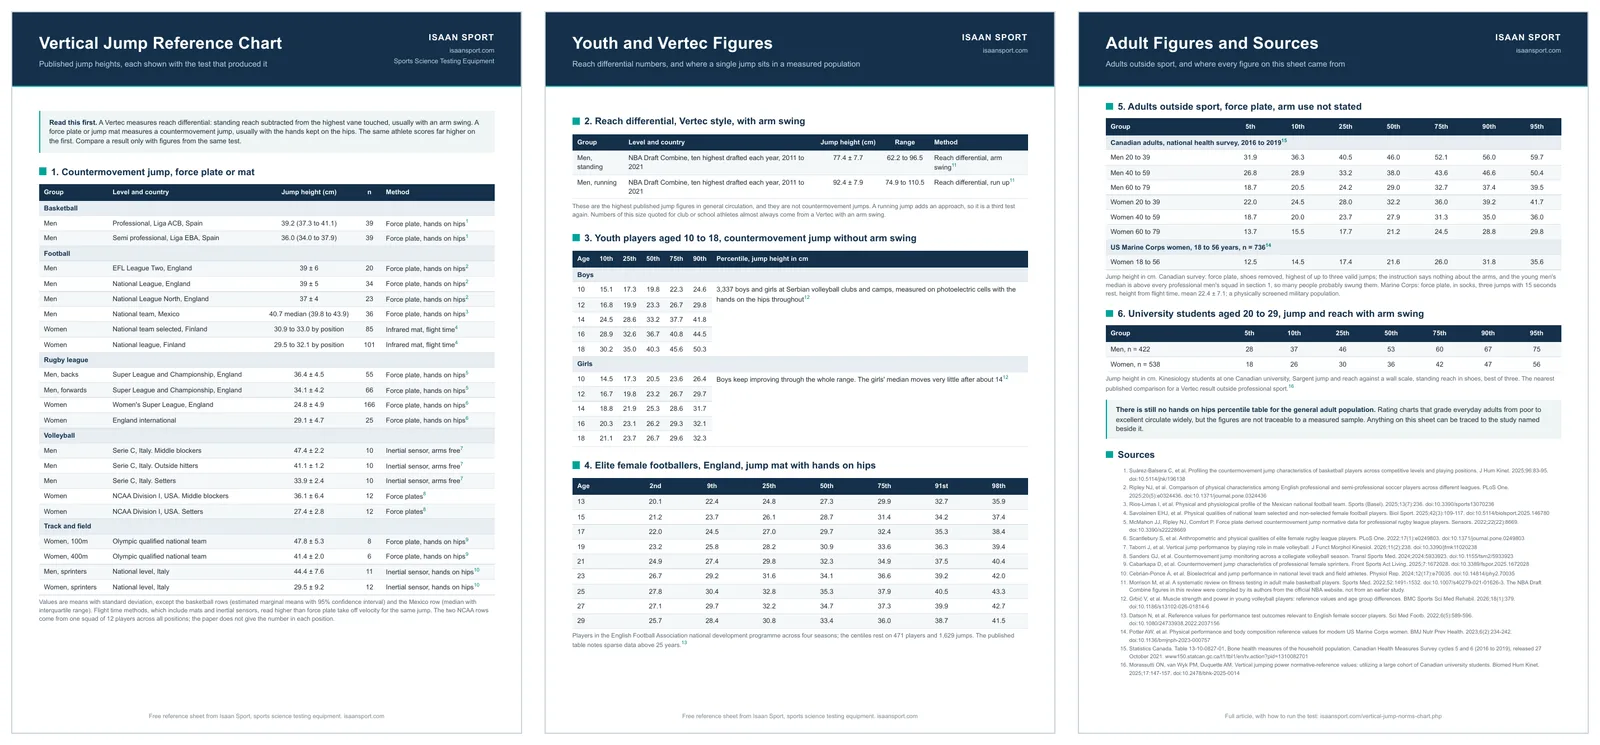
Every figure on this page names the study it came from, the test, the sample and the country. Enter a result in the calculator below to see where it sits against the tables that fit your test, age and sex, or read the tables and use the three page printable, which carries the same figures.
Download the Printable PDF
Vertical Jump Calculator
Enter your best jump in centimetres, your age and sex, and choose the test you used. A hands on hips jump is rated against youth percentiles, women's football centiles, a Canadian national survey of adults and senior squad figures. A reach jump with an arm swing on a Vertec is rated against Canadian university students and compared with NBA Draft Combine figures.How the Calculator Works
Ages 10 to 18, hands on hips. Your jump is placed between two percentiles of the Serbian youth table below, which gives a row for every age from 10 to 18.12 Age is taken in whole years, so 16 and a half uses the age 16 row.
Women aged 13 to 29, hands on hips. The result is also placed on the English Football Association centiles.13 That table is published for odd ages only, so an even age uses the row one year younger: a 16 year old is read on the age 15 row. Women aged 18 to 56 are also placed on the US Marine Corps table.14
Adults aged 20 to 90, hands on hips. Your jump is placed on the Canadian national survey percentiles for your sex and age group: 20 to 39, 40 to 59 or 60 to 79.17 Ages 80 to 90 use the 60 to 79 row, the oldest published. The survey does not say where the arms were, so this is a rougher guide than the youth and football tables.
Adults, senior squads. For ages 18 and over the calculator also lists which published senior squad averages your jump reaches. These are squad means, not percentiles, so they tell you how you compare with a team rather than with the public. Only the hands on hips squads are used.
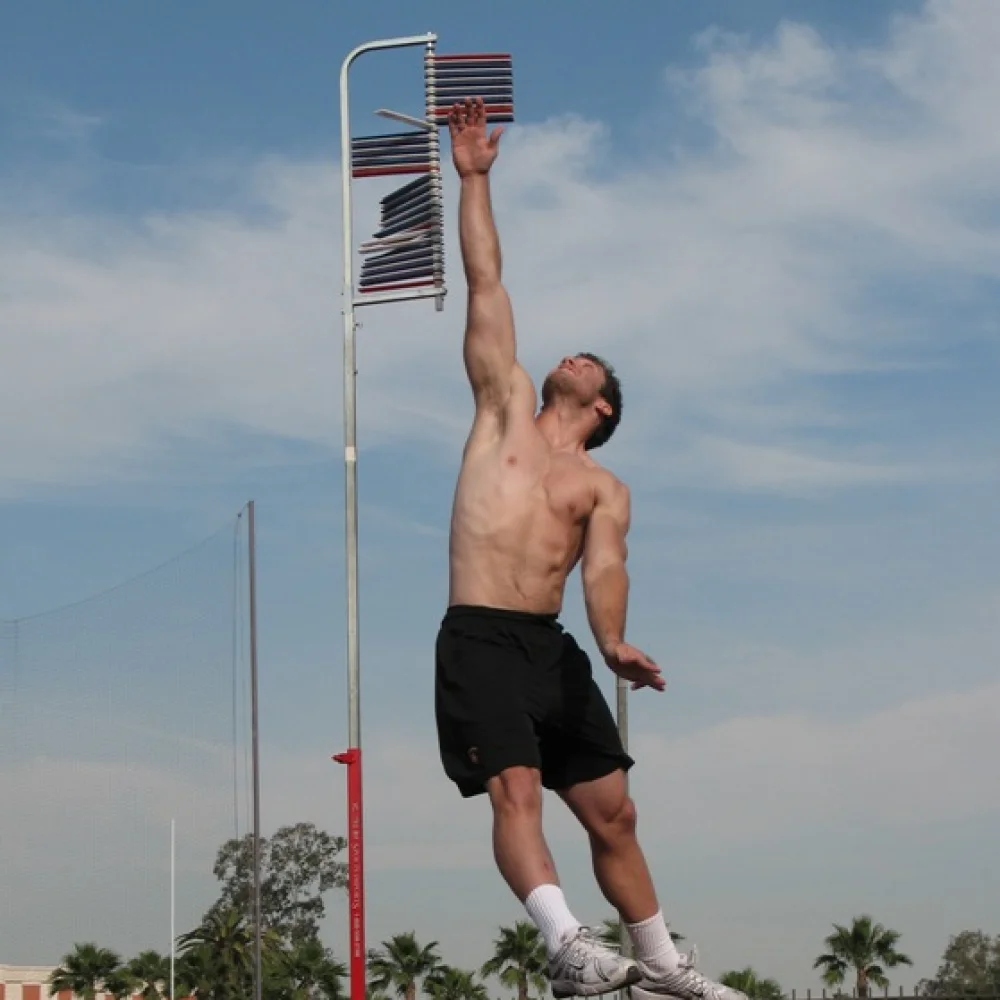
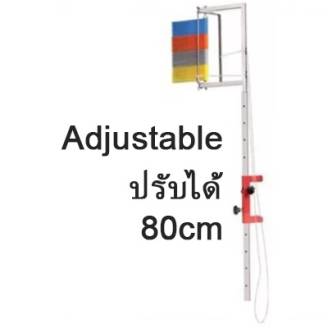
Reach jump with arm swing. No hands on hips table is used, and no conversion is applied, because no study we have found gives one. Ages 20 to 29 are placed on the percentiles of 960 Canadian university students who did a jump and reach test against a wall.18 Men aged 18 and over are also compared with the NBA Draft Combine figures.11 For anyone else the calculator says plainly that there is no traceable table to compare with.
Two Tests, Two Sets of Numbers
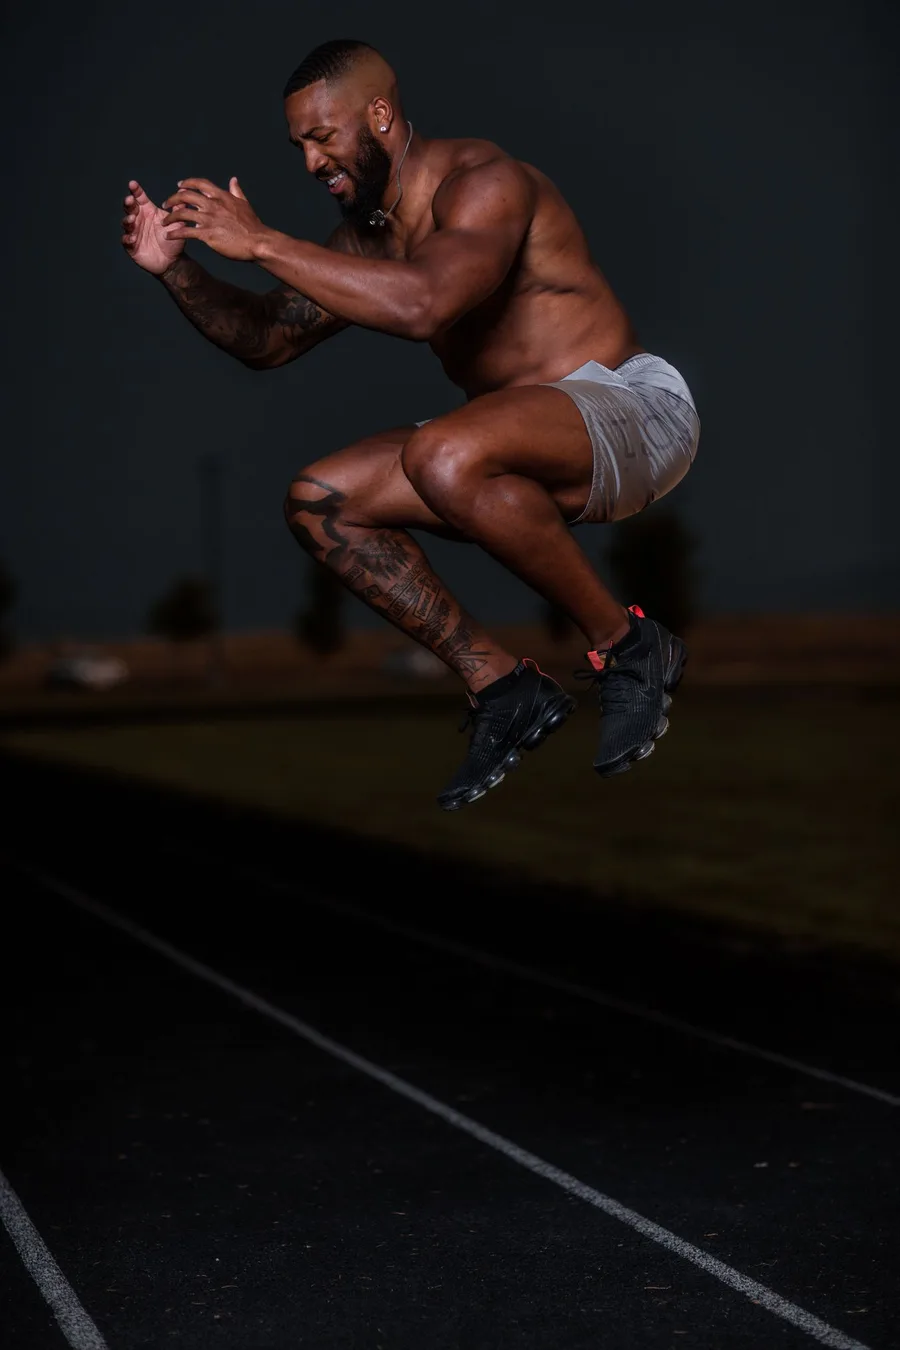
Countermovement jump on a force plate or mat. The athlete dips and jumps, usually with the hands kept on the hips so the arms cannot add anything, and the equipment calculates height from take off velocity (force plate) or from time in the air (mat or inertial sensor). This is the test almost all of the published research uses.
The two are not interchangeable. In a force plate study of 18 men who jumped with and without an arm swing, and with and without a countermovement, both raised jump height, but the arm swing had the larger effect.16 Even within the second group the method matters. Flight time readings from mats and sensors come out higher than force plate readings for the same jump. The authors of the rugby league dataset below put it plainly when they describe flight time estimates: "this method usually overestimates jump height".5
So the only safe comparison is against figures measured the same way, and the only safe progress check is against your own earlier results with the same equipment, footwear and protocol.
Senior Level Athletes: Countermovement Jump
All of these are countermovement jumps measured on a force plate, a mat or an inertial sensor. The method column matters as much as the number.| Group | Level and country | Jump height | n | Method |
|---|---|---|---|---|
| Basketball, men | Professional, Liga ACB, Spain | 39.2cm (37.3 to 41.1) | 39 | Force plate, hands on hips1 |
| Basketball, men | Semi professional, Liga EBA, Spain | 36.0cm (34.0 to 37.9) | 39 | Force plate, hands on hips1 |
| Football, men | EFL League Two, England | 39cm (SD 6) | 20 | Force plate, hands on hips2 |
| Football, men | National League, England | 39cm (SD 5) | 34 | Force plate, hands on hips2 |
| Football, men | National League North, England | 37cm (SD 4) | 23 | Force plate, hands on hips2 |
| Football, men | National team, Mexico | 40.7cm median (39.8 to 43.9) | 36 | Force plate, hands on hips3 |
| Football, women | National team selected, Finland | 30.9 to 33.0cm by position | 85 | Infrared mat, flight time4 |
| Football, women | National league, Finland | 29.5 to 32.1cm by position | 101 | Infrared mat, flight time4 |
| Rugby league, men | Super League and Championship backs, England | 36.4cm (SD 4.5) | 55 | Force plate, hands on hips5 |
| Rugby league, men | Super League and Championship forwards, England | 34.1cm (SD 4.2) | 66 | Force plate, hands on hips5 |
| Rugby league, women | Women's Super League, England | 24.8cm (SD 4.9) | 166 | Force plate, hands on hips6 |
| Rugby league, women | England international | 29.1cm (SD 4.7) | 25 | Force plate, hands on hips6 |
| Volleyball, men | Serie C middle blockers, Italy | 47.4cm (SD 2.2) | 10 | Inertial sensor, arms free7 |
| Volleyball, men | Serie C outside hitters, Italy | 41.1cm (SD 1.2) | 10 | Inertial sensor, arms free7 |
| Volleyball, men | Serie C setters, Italy | 33.9cm (SD 2.4) | 10 | Inertial sensor, arms free7 |
| Volleyball, women | NCAA Division I middle blockers, USA | 36.1cm (SD 6.4) | 12 | Force plates8 |
| Volleyball, women | NCAA Division I setters, USA | 27.4cm (SD 2.8) | 12 | Force plates8 |
| Sprinters, women | 100m, Olympic qualified national team | 47.8cm (SD 5.3) | 8 | Force plate, hands on hips9 |
| Sprinters, women | 400m, Olympic qualified national team | 41.4cm (SD 2.0) | 6 | Force plate, hands on hips9 |
| Sprinters, men | National level, Italy | 44.4cm (SD 7.6) | 11 | Inertial sensor, hands on hips10 |
| Sprinters, women | National level, Italy | 29.5cm (SD 9.2) | 12 | Inertial sensor, hands on hips10 |
Two things stand out. The first is how tight the range is: most senior male squads in team sports sit between 34 and 41cm, and the highest figure in the table belongs to Olympic level women sprinters at 47.8cm. The second is that position matters more than sport in places. Volleyball middle blockers and setters in the same Italian squads are 13cm apart. The two NCAA rows come from one squad of 12 players across all positions; the paper does not give the number in each position.8
NBA Draft Combine Figures, With an Arm Swing
| Group | Level | Jump height | Range |
|---|---|---|---|
| Men, standing jump | 100 players drafted into the NBA, 2011 to 2021 | 77.4cm (SD 7.7) | 62.2 to 96.5cm |
| Men, running jump | 100 players drafted into the NBA, 2011 to 2021 | 92.4cm (SD 7.9) | 74.9 to 110.5cm |
These are jumps with an arm swing, and the second one adds a run up, which makes it a third test again.11 They are the numbers behind most of the jump heights quoted in general conversation, which is why a 65 to 80cm figure for basketball looks normal to people and a 39cm figure looks wrong. Both are right, for different tests.
Worth knowing about the source: the review authors took the ten highest drafted combine participants from each of ten drafts, collected from the official NBA website rather than from an earlier study.11 The players in the sample were, on average, the 16th or 17th player chosen in their draft (an average draft position of 16.6), so this is a group of drafted players rather than the top ten picks. That is still traceable, but it is not peer reviewed data in the way the rest of this page is.
University Students, Jump and Reach With an Arm Swing
The most recent reach jump percentile table we could read in full comes from 960 kinesiology students aged 20 to 29 at a Canadian university, 422 men and 538 women.18 They did a Sargent jump and reach against a wall scale, the same idea as a Vertec: standing reach taken in shoes, then one dip with an arm swing and a touch as high as possible, best of three jumps with 10 to 15 seconds rest.| Group | 5th | 10th | 25th | 50th | 75th | 90th | 95th |
|---|---|---|---|---|---|---|---|
| Men | 28 | 37 | 46 | 53 | 60 | 67 | 75 |
| Women | 18 | 26 | 30 | 36 | 42 | 47 | 56 |
All figures in centimetres, converted from the metres published, and the paper gives every fifth percentile, which the calculator uses. This is a sample of students on one course rather than a national norm, but it is the nearest published comparison for a Vertec result outside professional sport. The men's median of 53cm against 77.4cm for drafted NBA players shows how far apart a student and a professional basketball prospect are on the same kind of test.
Youth Players Aged 10 to 18
Percentiles from 3,337 boys and girls at Serbian volleyball clubs and camps, measured on Optojump photoelectric cells with the hands on the hips throughout, best of three jumps.12 The paper gives a row for every age, and the n column shows how many players each row is built on.Boys
| Age | n | 10th | 25th | 50th | 75th | 90th |
|---|---|---|---|---|---|---|
| 10 | 34 | 15.1 | 17.3 | 19.8 | 22.3 | 24.6 |
| 11 | 29 | 16.5 | 19.1 | 22.1 | 25.1 | 27.8 |
| 12 | 59 | 16.8 | 19.9 | 23.3 | 26.7 | 29.8 |
| 13 | 48 | 18.9 | 22.8 | 27.2 | 31.7 | 35.6 |
| 14 | 79 | 24.5 | 28.6 | 33.2 | 37.7 | 41.8 |
| 15 | 80 | 25.8 | 29.6 | 33.8 | 38.1 | 41.9 |
| 16 | 76 | 28.9 | 32.6 | 36.7 | 40.8 | 44.5 |
| 17 | 69 | 30.8 | 33.9 | 37.4 | 40.8 | 43.9 |
| 18 | 65 | 30.2 | 35.0 | 40.3 | 45.6 | 50.3 |
Girls
| Age | n | 10th | 25th | 50th | 75th | 90th |
|---|---|---|---|---|---|---|
| 10 | 152 | 14.5 | 17.3 | 20.5 | 23.6 | 26.4 |
| 11 | 181 | 16.4 | 19.1 | 22.2 | 25.2 | 27.9 |
| 12 | 370 | 16.7 | 19.8 | 23.2 | 26.7 | 29.7 |
| 13 | 587 | 18.2 | 21.1 | 24.3 | 27.5 | 30.4 |
| 14 | 600 | 18.8 | 21.9 | 25.3 | 28.6 | 31.7 |
| 15 | 441 | 19.5 | 22.5 | 25.8 | 29.1 | 32.1 |
| 16 | 271 | 20.3 | 23.1 | 26.2 | 29.3 | 32.1 |
| 17 | 123 | 20.9 | 23.6 | 26.6 | 29.7 | 32.4 |
| 18 | 73 | 21.1 | 23.7 | 26.7 | 29.6 | 32.3 |
All figures in centimetres. The boys keep improving across the whole range, with the biggest rise between 12 and 14, almost 10cm at the median. The girls' median moves about 1.4cm in the four years after 14, so a 16 year old girl who has stopped improving is normal rather than a problem, and training effects show up better against her own earlier results than against the table. The boys' rows at 10 and 11 rest on about 30 players each, so treat them as the least certain part of the table.
A second youth dataset is worth knowing about: 7,614 Colombian schoolchildren aged 9 to 17.9, measured on a digital jump meter, where the 50th percentile runs from 24.0 to 38.0cm for boys and 22.3 to 27.0cm for girls across the age range.15 The full percentile tables in that paper are behind a paywall, so only the medians are quoted here.
Elite Female Footballers by Age
This is the most detailed set of reference values published for any female sport: 479 players in the English Football Association national development programme, 1,715 test results over four seasons, aged 12.7 to 36.0. The jump centiles below are built on 471 of those players and 1,629 jumps on a jump mat with the hands on the hips.13| Age | 2nd | 9th | 25th | 50th | 75th | 91st | 98th |
|---|---|---|---|---|---|---|---|
| 13 | 20.1 | 22.4 | 24.8 | 27.3 | 29.9 | 32.7 | 35.9 |
| 15 | 21.2 | 23.7 | 26.1 | 28.7 | 31.4 | 34.2 | 37.4 |
| 17 | 22.0 | 24.5 | 27.0 | 29.7 | 32.4 | 35.3 | 38.4 |
| 19 | 23.2 | 25.8 | 28.2 | 30.9 | 33.6 | 36.3 | 39.4 |
| 21 | 24.9 | 27.4 | 29.8 | 32.3 | 34.9 | 37.5 | 40.4 |
| 23 | 26.7 | 29.2 | 31.6 | 34.1 | 36.6 | 39.2 | 42.0 |
| 25 | 27.8 | 30.4 | 32.8 | 35.3 | 37.9 | 40.5 | 43.3 |
| 27 | 27.1 | 29.7 | 32.2 | 34.7 | 37.3 | 39.9 | 42.7 |
| 29 | 25.7 | 28.4 | 30.8 | 33.4 | 36.0 | 38.7 | 41.5 |
All figures in centimetres. The median improves until about 25 years old and then falls away, and the paper notes that it had sparse data above 25 years, so treat the last two rows as the weakest part of the table.
Adults Outside Sport
Rating charts that grade everyday adults from poor to excellent are easy to find, but the figures in them cannot be traced to a measured sample, which is why they are not reproduced here. Two published sources do come from measured adults outside professional sport.Canadian adults, national health survey. Statistics Canada tested a nationally representative sample of the household population on a force plate between 2016 and 2019, with shoes removed, up to two practice jumps and then up to three valid jumps, and published the highest jump as percentiles by age and sex.17
| Group | 5th | 10th | 25th | 50th | 75th | 90th | 95th |
|---|---|---|---|---|---|---|---|
| Men 20 to 39 | 31.9 | 36.3 | 40.5 | 46.0 | 52.1 | 56.0 | 59.7 |
| Men 40 to 59 | 26.8 | 28.9 | 33.2 | 38.0 | 43.6 | 46.6 | 50.4 |
| Men 60 to 79 | 18.7 | 20.5 | 24.2 | 29.0 | 32.7 | 37.4 | 39.5 |
| Women 20 to 39 | 22.0 | 24.5 | 28.0 | 32.2 | 36.0 | 39.2 | 41.7 |
| Women 40 to 59 | 18.7 | 20.0 | 23.7 | 27.9 | 31.3 | 35.0 | 36.0 |
| Women 60 to 79 | 13.7 | 15.5 | 17.7 | 21.2 | 24.5 | 28.8 | 29.8 |
All figures in centimetres, converted from the metres published. The instruction was simply to bend down and jump as high as possible, with nothing said about the arms. The median for men aged 20 to 39, 46.0cm, is higher than every professional men's team sport squad measured with the hands on hips above (34 to 41cm), so it is likely that many people used their arms. A hands on hips result will usually rate lower on this table than it would against a hands on hips sample. The drop with age is clear in both sexes: the median for men aged 60 to 79 is 17cm below the youngest group.
US Marine Corps women. A sample of 736 active duty women aged 18 to 56, tested on a force plate in socks, three jumps with 15 seconds rest, height calculated from flight time.14
| Percentile | 5th | 10th | 25th | 50th | 75th | 90th | 95th |
|---|---|---|---|---|---|---|---|
| Jump height | 12.5cm | 14.5cm | 17.4cm | 21.6cm | 26.0cm | 31.8cm | 35.6cm |
The mean was 22.4cm (SD 7.1). Two limits worth stating. This is a physically screened military population rather than the public, and the paper does not say whether the arms were used, so it cannot be lined up exactly against the hands on hips figures above.
How to Test So the Number Means Something
- Set the standing reach properly. Feet flat on the floor, heels down, one arm straight up, fingers extended. A reach taken on tiptoes takes centimetres off every jump that follows.
- Best of three. Most of the studies above recorded two or three attempts and kept the best.
- Keep the protocol identical. Same warm up, same footwear, same surface, same time of day, same arm rule. Write down which test you used and whether the arms were free, because the number is meaningless six months later without it.
- Choose the arm rule to suit the sport. A basketball or volleyball player jumps with their arms, so a reach differential test with an arm swing describes what they do in a game. A hands on hips jump isolates the legs, which is the better measure of training effect.
- Retest every four to six weeks. Jump height moves slowly. Testing more often mostly measures how tired the athlete is that day.
Common Questions
What is a good vertical jump?
It depends entirely on the test. On a force plate with the hands on the hips, senior men in professional team sports mostly measure between 34 and 41cm, and Olympic level women sprinters reach about 48cm. With a full arm swing the same standard of athlete measures far higher, with players drafted into the NBA averaging 77.4cm in the standing jump at the Draft Combine. Compare your result only with figures from the test you used.
What is the average vertical jump for a 16 year old?
In hands on hips testing of young Serbian volleyball players, the 50th percentile at 16 was 36.7cm for boys and 26.2cm for girls. The 90th percentile was 44.5cm and 32.1cm. These are players in a jumping sport, so a 16 year old who does not train will usually sit lower. A jump with an arm swing on a Vertec cannot be read on this table, because the arm swing adds height the table does not include.
Is 50cm a good vertical jump?
With the hands on the hips, 50cm is a very high result. Every hands on hips group average here is lower, the highest being Olympic women sprinters at 47.8cm. The men's figures above 50cm, from the NBA Draft Combine, come from a different test, a jump with an arm swing. With an arm swing, 50cm is below the lowest drafted player's standing jump of 62.2cm. Always say which test the number came from.
Why is my Vertec result so much higher than the research figures?
Because a Vertec measures a different thing. It records how far above your standing reach you can touch, usually with a full arm swing, and the arm swing has a larger effect on jump height than the dip before take off. Nearly all published jump research uses a countermovement jump with the hands on the hips, measured on a force plate or a mat. Neither number is wrong, but they cannot be compared with each other.
Can I compare a jump mat result with a force plate result?
Not closely. A mat or wearable sensor works out height from time in the air, while a force plate can work it out from take off velocity, and the flight time method reads higher for the same jump. The authors of the rugby league dataset say flight time "usually overestimates jump height". Within a squad it matters less, as long as every athlete is tested on the same equipment every time.
What is a good vertical jump for a 14 year old?
Among 3,337 young Serbian volleyball players tested with the hands on the hips, the median 14 year old boy jumped 33.2cm and the median girl 25.3cm. The 90th percentile was 41.8cm for boys and 31.7cm for girls. Those figures come from young athletes in a jumping sport, so a schoolchild who is not training should be expected to sit lower rather than treated as behind.
Is there a vertical jump chart for ordinary adults?
Yes, a few, though none is a hands on hips norm. Statistics Canada's national health survey gives force plate percentiles for adults aged 20 to 79, with medians of 46.0cm for men and 32.2cm for women aged 20 to 39, but it does not say whether the arms were used. For a jump and reach with an arm swing, 960 Canadian university students aged 20 to 29 had medians of 53cm for men and 36cm for women.
How often should the test be repeated?
Every four to six weeks is enough for most programmes. Jump height changes slowly, so more frequent testing mostly captures fatigue, sleep and time of day rather than training effect. Keep the warm up, footwear, surface and arm rule identical between tests, take the best of three attempts, and log the method beside the number so the result still means something in six months.
Related Reading
- Standing long jump norms chart: the other lower body power test, with reference tables and a printable.
- Power cleans for vertical jump: what the research says strength training adds to a jump, in centimetres.
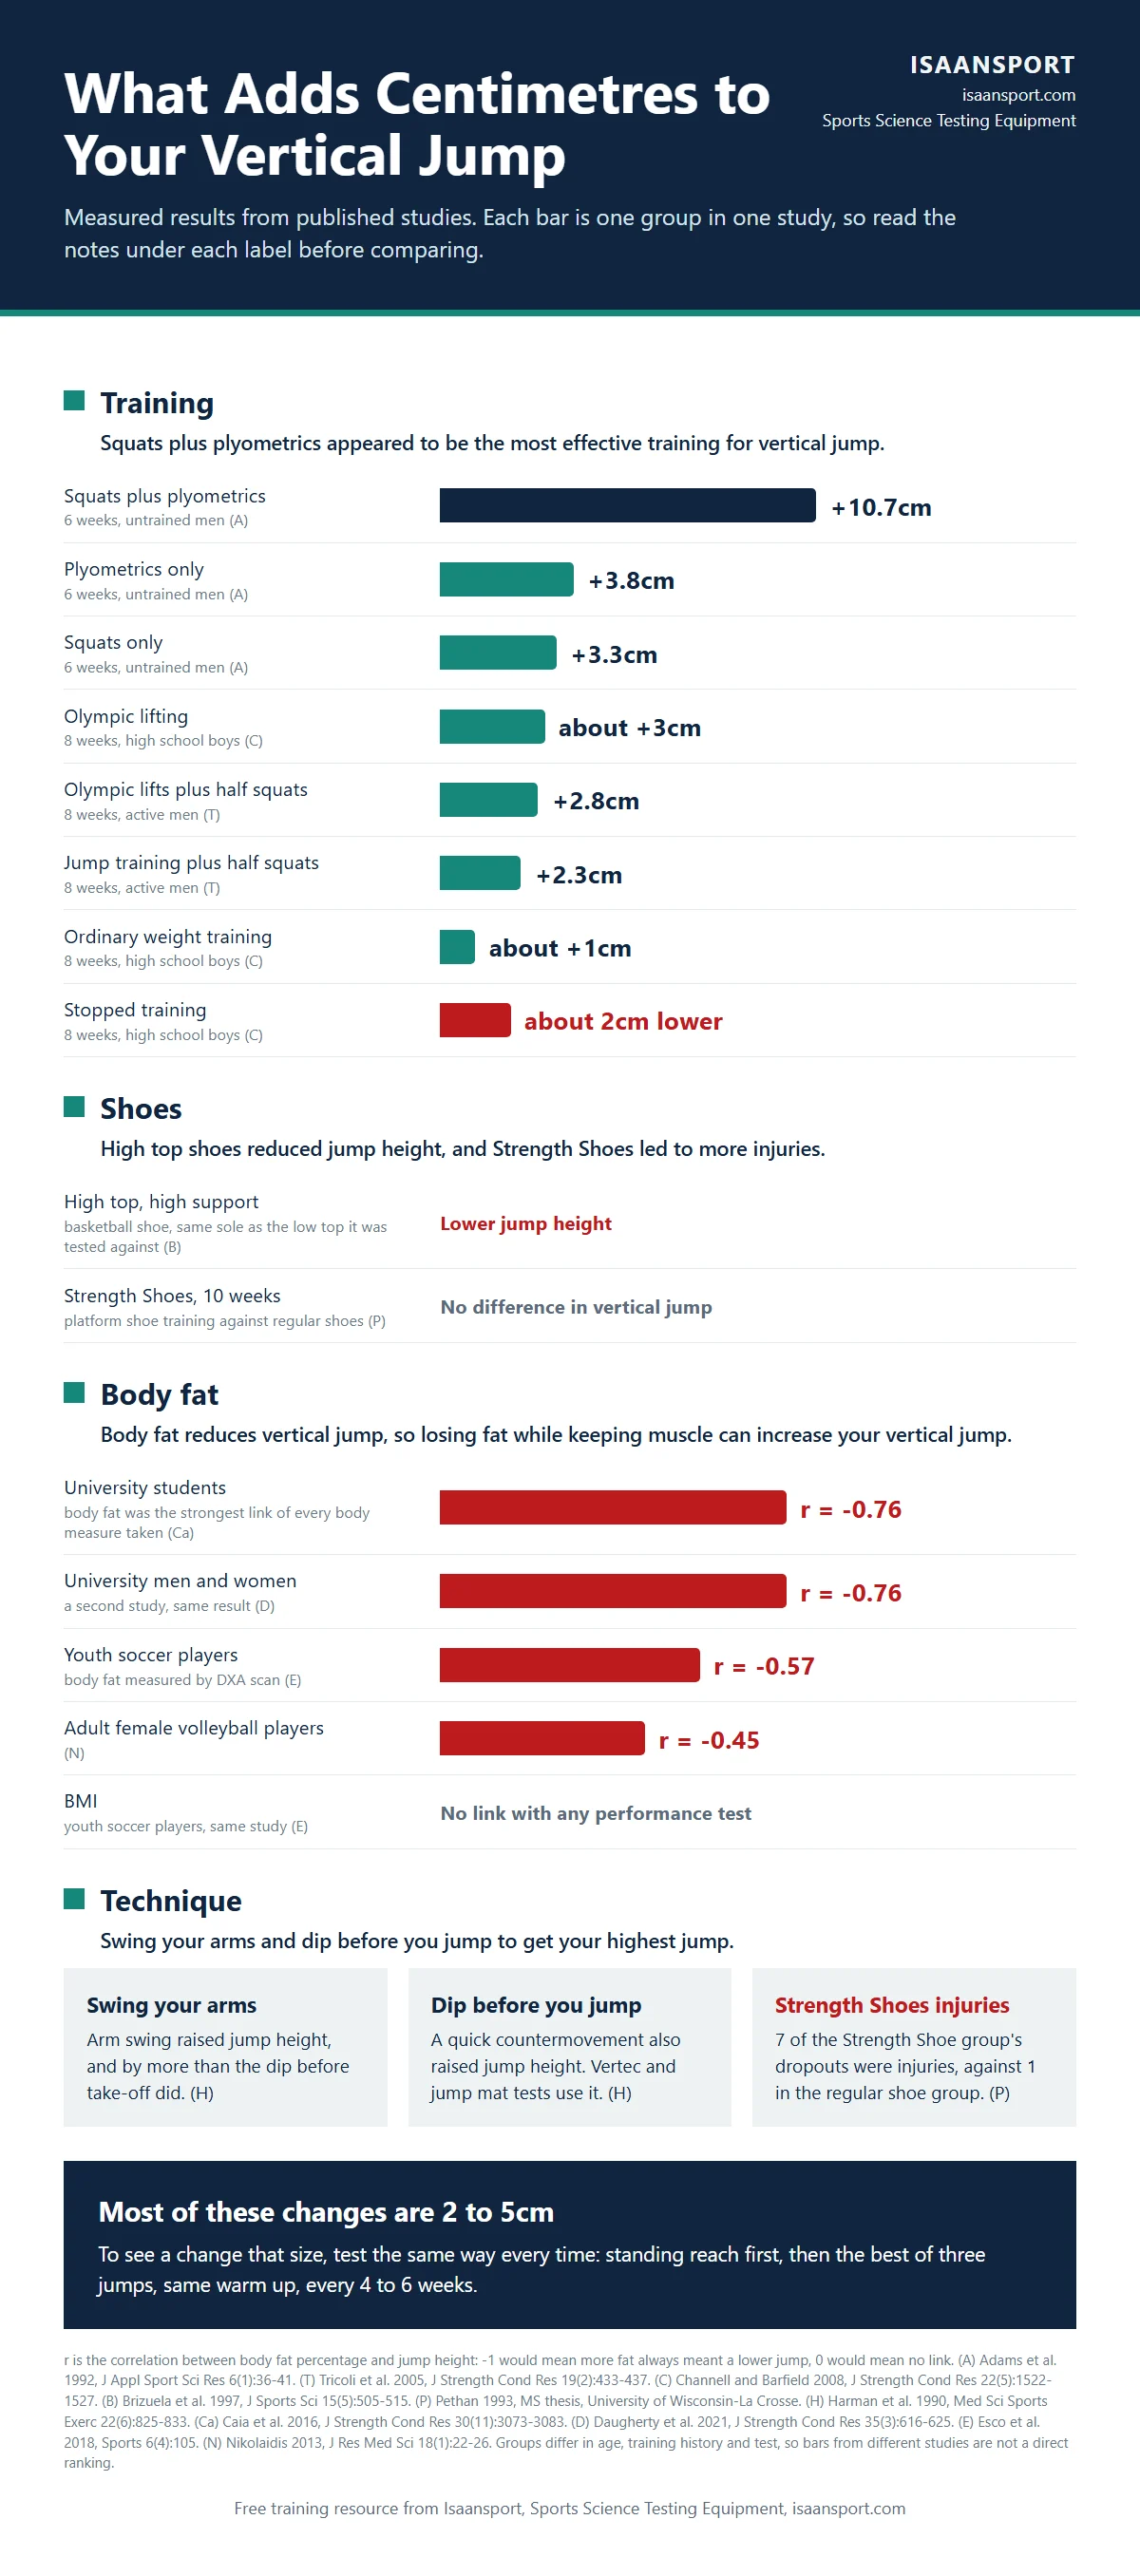
- What adds centimetres to your vertical jump: arm swing, footwear, body composition and training in one infographic.
- Grip strength norms and calculator: rate a hand dynamometer reading by age and sex, including the Thai standard.
References
- Suárez-Balsera C, Ferioli D, Marín-Cascales E, et al. Profiling the countermovement jump characteristics of basketball players across competitive levels and playing positions. Journal of Human Kinetics. 2025;96:83-95. doi:10.5114/jhk/196138
- Ripley NJ, Fahey J, Jones P, et al. Comparison of physical characteristics among English professional and semi-professional soccer players across different leagues. PLoS One. 2025;20(5):e0324436. doi:10.1371/journal.pone.0324436
- Rios-Limas I, Herrera-Amante CA, Carvajal-Veitía W, et al. Relating anthropometric profile to countermovement jump performance and external match load in Mexican national team soccer players: an exploratory study. Sports (Basel). 2025;13(7):236. doi:10.3390/sports13070236
- Savolainen EHJ, Ihalainen JK, Weckström K, et al. Female football players' key physical qualities: playing-position specific comparison between national-team selected and non-selected players. Biology of Sport. 2025;42(3):109-117. doi:10.5114/biolsport.2025.146780
- McMahon JJ, Ripley NJ, Comfort P. Force plate-derived countermovement jump normative data and benchmarks for professional rugby league players. Sensors. 2022;22(22):8669. doi:10.3390/s22228669
- Scantlebury S, McCormack S, Sawczuk T, et al. The anthropometric and physical qualities of women's rugby league Super League and international players; identifying differences in playing position and level. PLoS One. 2022;17(1):e0249803. doi:10.1371/journal.pone.0249803
- Taborri J, Strippoli M, Molinaro L, Rossi S. Functional differences across playing roles in volleyball: a sensor-based assessment. Journal of Functional Morphology and Kinesiology. 2026;11(2):238. doi:10.3390/jfmk11020238
- Sanders GJ, Skodinski S, Cabarkapa DV, et al. Positional differences in jump loads and force and velocity metrics throughout a 16-week Division I volleyball season. Translational Sports Medicine. 2024;2024:5933923. doi:10.1155/tsm2/5933923
- Cabarkapa D, Batra A, Cabarkapa DV, Fry AC. Comparison of lower-body neuromuscular performance profiles between 100 m and 400 m Olympic sprinters. Frontiers in Sports and Active Living. 2025;7:1672028. doi:10.3389/fspor.2025.1672028
- Cebrián-Ponce Á, Levi Micheli M, Politi C, et al. Bioelectrical impedance vector analysis and track and field jump performance across different specialties: sex differences and electrode configuration. Physiological Reports. 2024;12(17):e70035. doi:10.14814/phy2.70035
- Morrison M, Martin DT, Talpey S, et al. A systematic review on fitness testing in adult male basketball players: tests adopted, characteristics reported and recommendations for practice. Sports Medicine. 2022;52(7):1491-1532. doi:10.1007/s40279-021-01626-3. Table 3 gives the NBA Draft Combine figures quoted above, compiled by the review authors from the official NBA website rather than from an earlier study.
- Grbić V, Toskić L, Marković M, Dakić M, Đurić S. Muscle strength and power in young volleyball players: reference values and age group differences. BMC Sports Science, Medicine and Rehabilitation. 2026;18(1):379. doi:10.1186/s13102-026-01814-6. Table 4 gives the percentiles reproduced above, Table 1 the number of players at each age.
- Datson N, Weston M, Drust B, Atkinson G, Lolli L, Gregson W. Reference values for performance test outcomes relevant to English female soccer players. Science and Medicine in Football. 2022;6(5):589-596. doi:10.1080/24733938.2022.2037156. Table 3 gives the centiles reproduced above.
- Potter AW, Looney DP, Tharion WJ, et al. Physical performance and body composition reference values for modern US Marine Corps women. BMJ Nutrition, Prevention and Health. 2023;6(2):234-242. doi:10.1136/bmjnph-2023-000757. Table 4 gives the percentiles reproduced above.
- Ramírez-Vélez R, Correa-Bautista JE, Lobelo F, et al. Vertical jump and leg power normative data for Colombian schoolchildren aged 9-17.9 years: the FUPRECOL study. Journal of Strength and Conditioning Research. 2017;31(4):990-998. doi:10.1519/JSC.0000000000001550
- Harman EA, Rosenstein MT, Frykman PN, Rosenstein RM. The effects of arms and countermovement on vertical jumping. Medicine and Science in Sports and Exercise. 1990;22(6):825-833. doi:10.1249/00005768-199012000-00015
- Statistics Canada. Table 13-10-0827-01, Bone health measures of the household population. Canadian Health Measures Survey, cycles 5 and 6 (2016 to 2019), released 27 October 2021. Measure "Jumping, maximum height", percentiles reproduced above. Test protocol from the cycle 5 clinic questionnaire: single two leg jump on a force plate, shoes removed.
- Morassutti ON, van Wyk PM, Duquette AM. Vertical jumping power normative-reference values: utilizing a large cohort of Canadian university students. Biomedical Human Kinetics. 2025;17:147-157. doi:10.2478/bhk-2025-0014. Tables 5 and 6 give the percentiles reproduced above.
Dr Wannaporn Sumranpat Brady is a physiotherapist with a PhD, not a medical doctor, and a lecturer in the Department of Health Science and Sports at Mahasarakham University's Faculty of Education. Her research is on patellofemoral pain (PFP). She holds a PhD in Exercise and Sport Science from Mahasarakham University, an MSc in Physical Therapy from Khon Kaen University and a BSc in Physical Therapy from Naresuan University, and has also published on athletic injury rehabilitation, sports biomechanics and physical training programme design. She co-founded Isaan Sport Technology and writes its sports science articles, which take their figures from journal studies and from tests on the equipment the store sells.