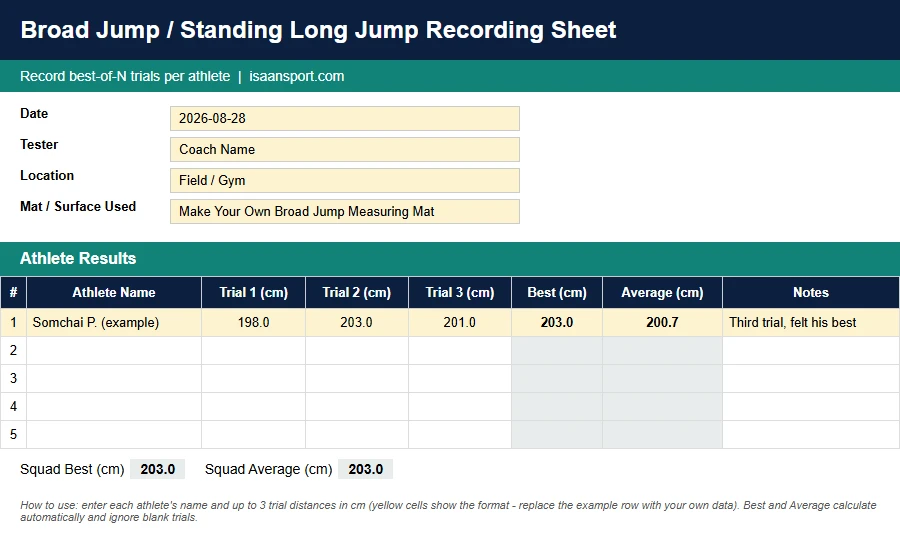
When testing athletes for broad jump distance, you'll want to have a standard template format to improve consistency between tests. We provide a free template for Excel below - in this spreadsheet, you can log three jump distances per athlete and the sheet works out the best and average distance for you. You may decide to print it out for testing days, fill it in, then transcribe the values later, so the formulas can do their calculations.
Download the Recording Sheet (XLSX)
It's also valuable to measure progress over time, so we have a second spreadsheet for recording jump distances on different dates (eg. every month, or across a season). Use this second spreadsheet to log each athlete's best distance from every test date side by side. You could merge the 2 spreadsheets to be 2 tabs in a single spreadsheet if you preferred, then duplicate the recording sheet tab for each testing day.
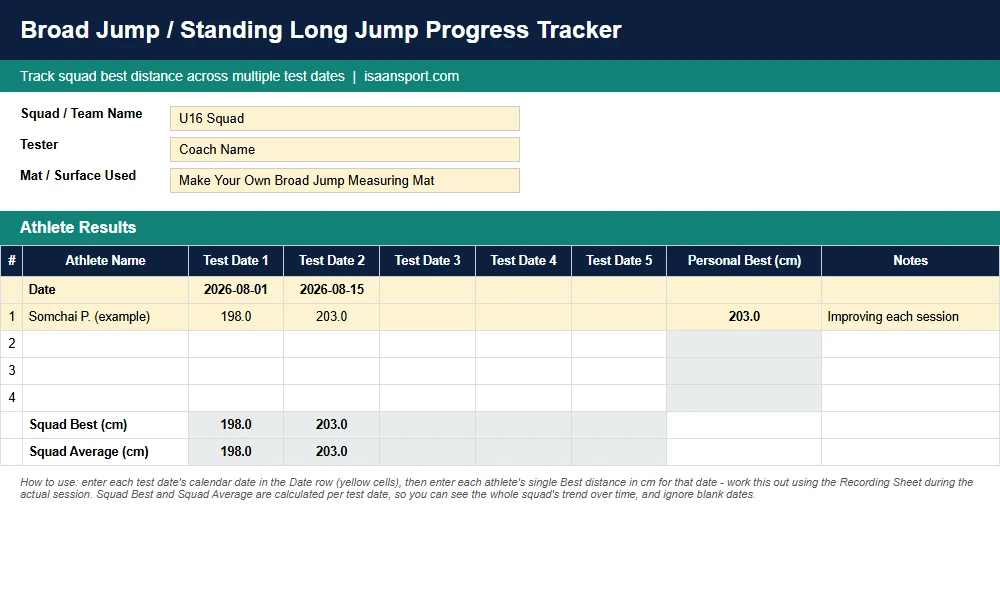
Download the Progress Tracker (XLSX)
Recording It Properly
Keep the same process for consistency purposes, and plan it in advance.
- Record every trial, not just the best. Three numbers per athlete let you see consistency or variance, not just their peak - useful for spotting technique issues a single jump would hide.
- Decide on best-of-N or average jump before you start. It's possible to use either the best jump or average jump value, depending if you want to measure for peak performance or consistency, but you'll want to decide in advance, particularly before using the progress tracker (longitudinal) spreadsheet.
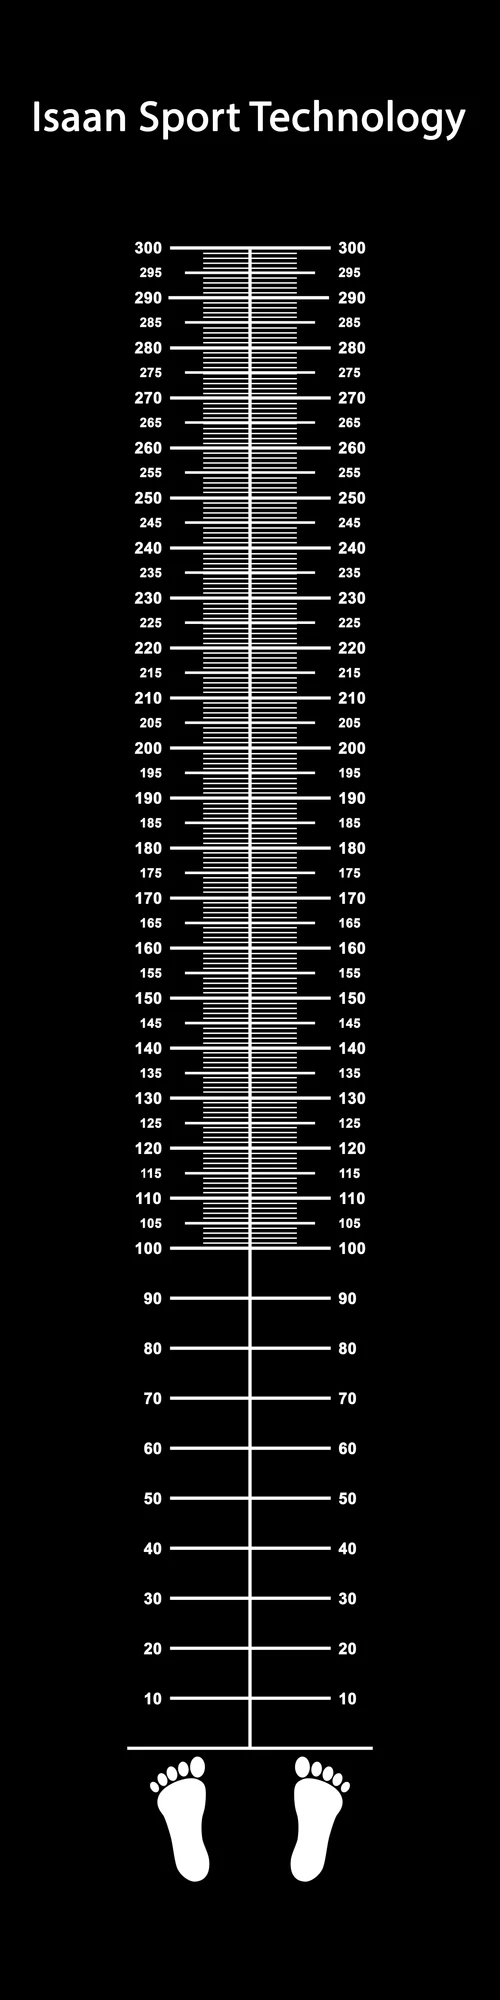
- Keep the units and measuring point consistent. Always measure to the nearest point of contact (usually the heel), in the same unit (cm is standard), from the same start line. You don't want the process changing between testing sessions or testers.
- Note anything unusual. A false start, a slip, or an injured athlete changes how you should read that number later - a notes column saves some head-scratching later.
What's in the Sheet
- Session details: date, tester, location, and mat/surface used
- Space for 20 athletes, three trials each
- Best and Average distance calculated automatically per athlete
- Squad-wide Best and Average Best, calculated across everyone entered
How to Use It
Fill in the session details at the top, then enter each athlete's name and their trial distances in cm - the yellow example row shows the format, just overwrite it with your own data. Best and Average fill in on their own and ignore any trial you leave blank, so it works whether you're running 1, 2, or 3 jumps per athlete.
Testing the Jump
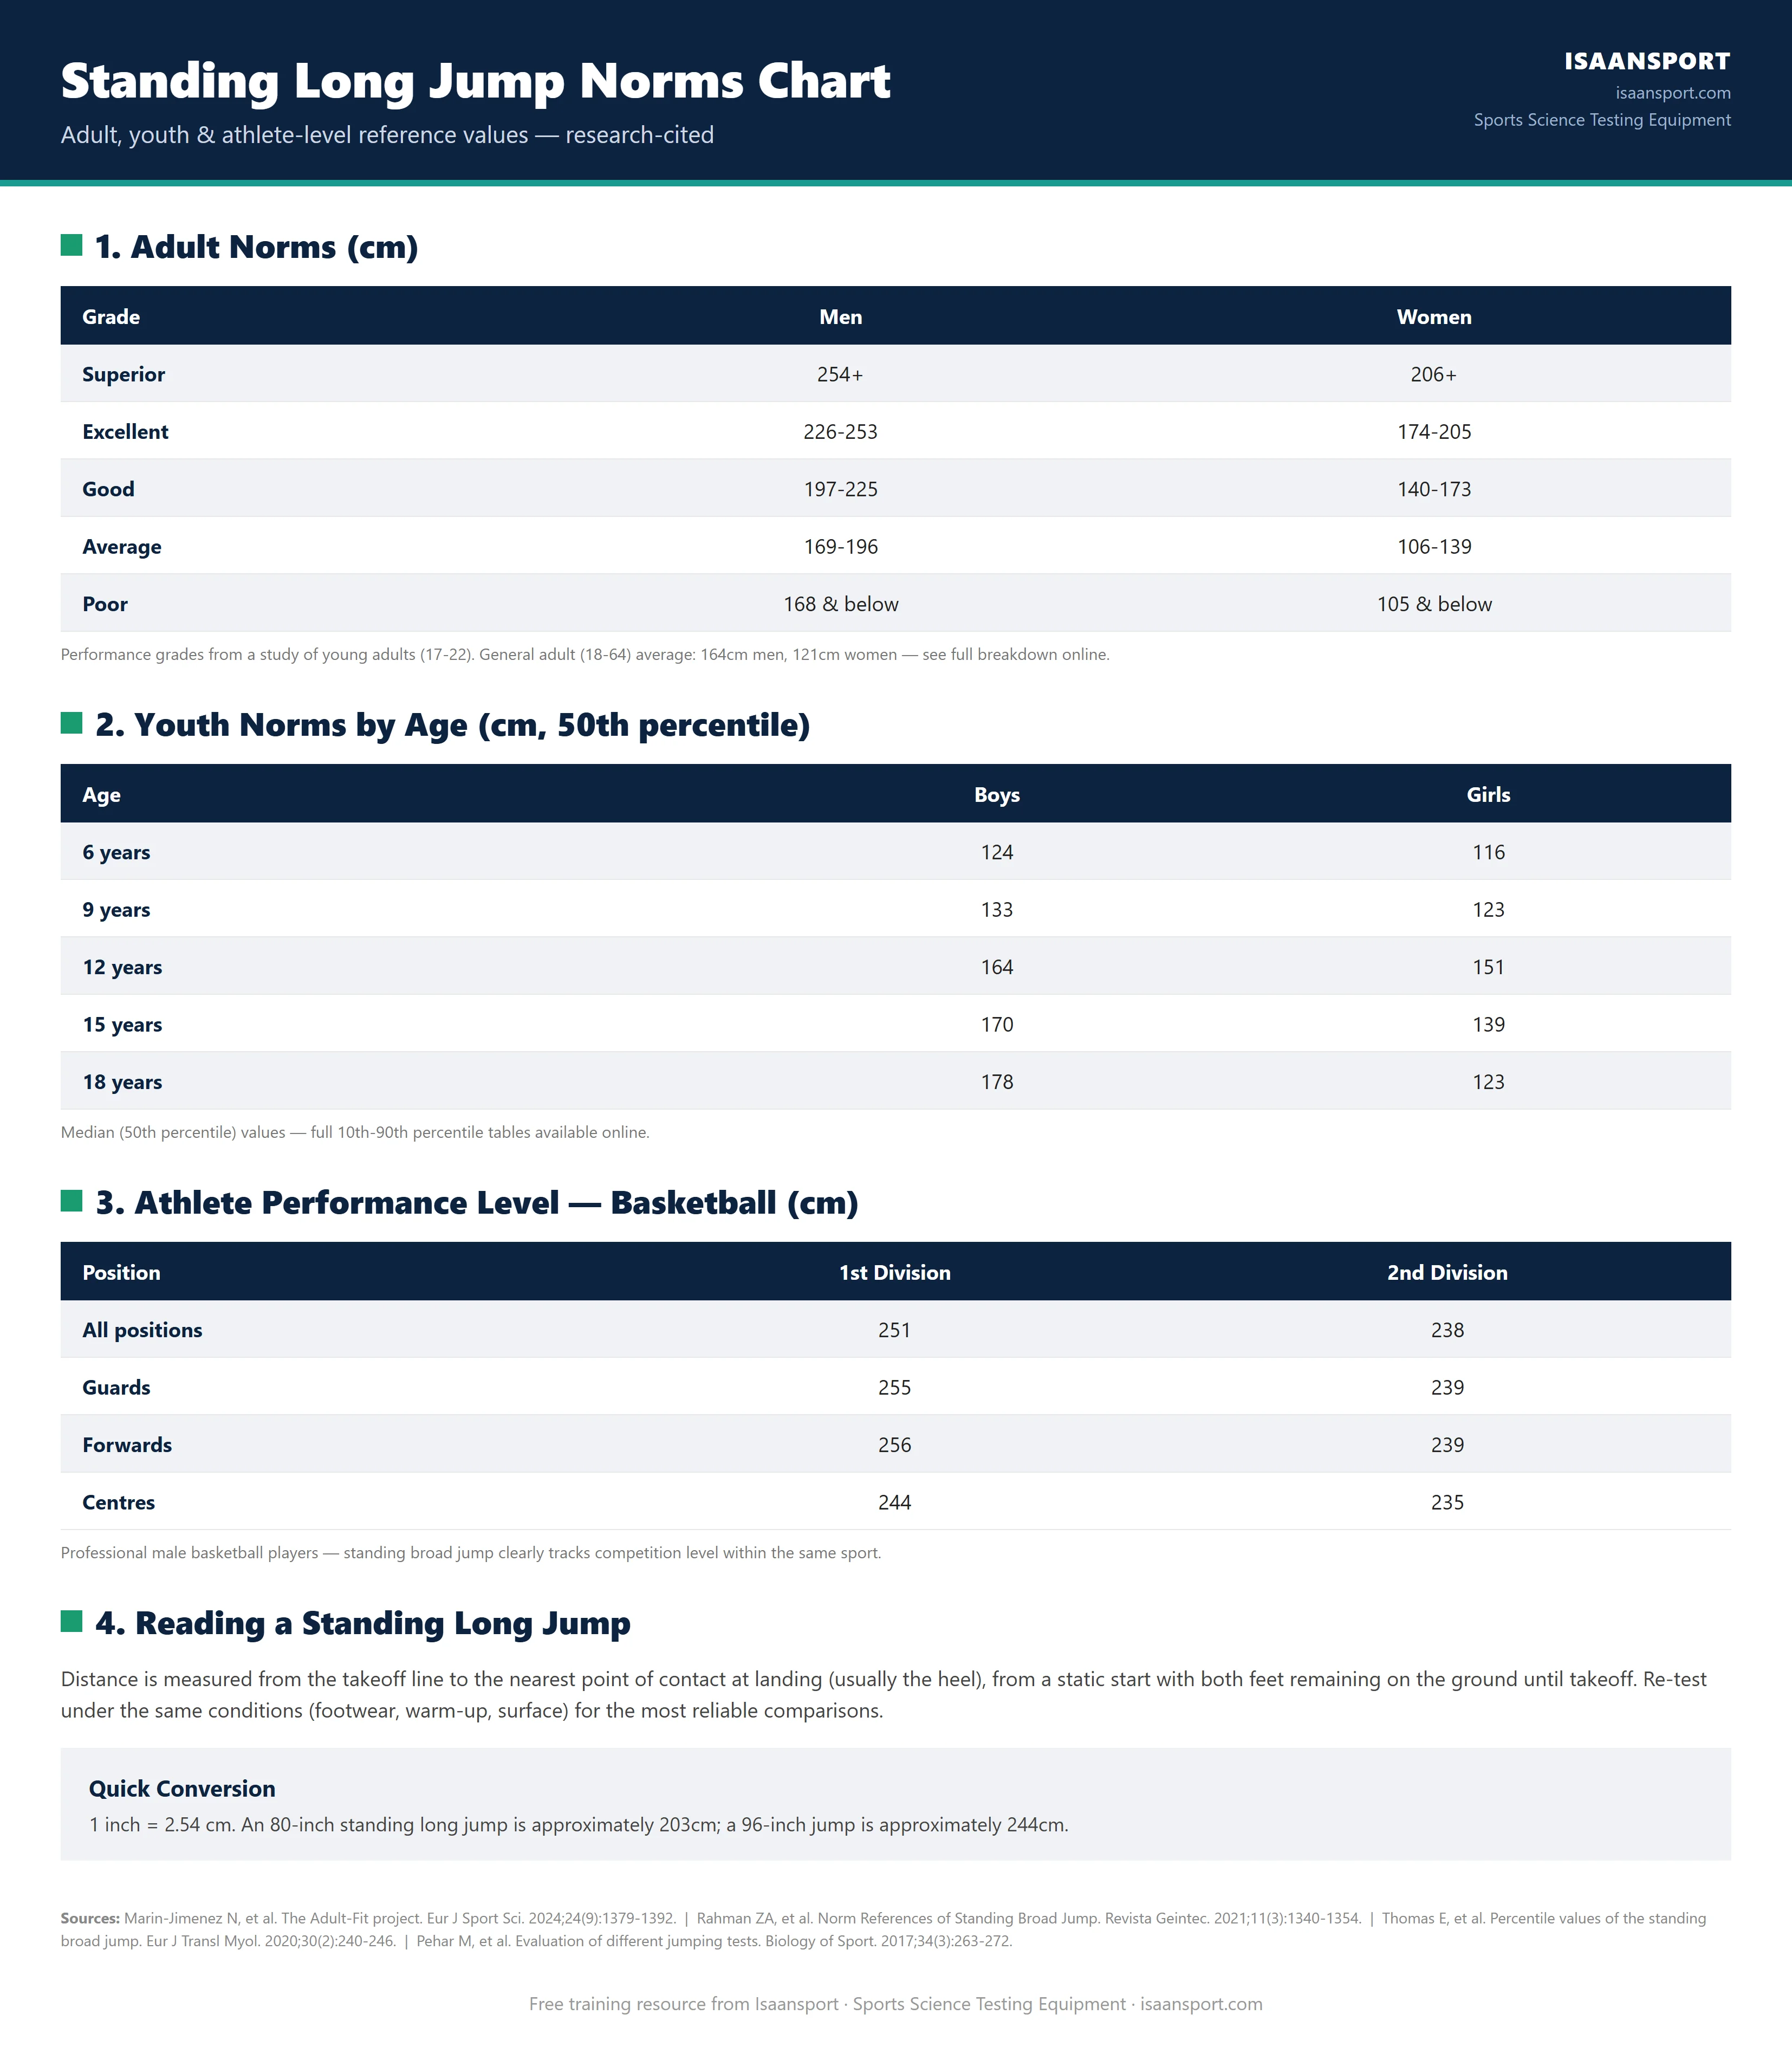
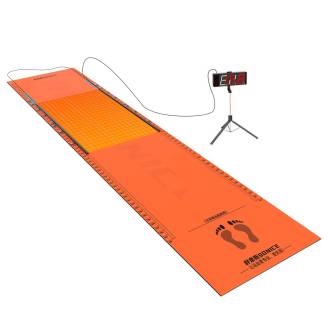
For accurate measurements, check out our Electronic Long Jump Test Mat, and see the Standing Long Jump Norms if wanting norms to compare the scores against.
How Much Change Counts as Real
A progress tracker is only worth keeping if you know how far a number has to move before it means something. Two test-retest studies in young children answer that, and the figure is larger than most coaches expect.
| Group tested | Gap between tests | Reliability | Change needed to beat measurement error |
|---|---|---|---|
| 171 Chilean preschoolers, mean age 5.4 years1 | 7 to 10 days | ICC 0.67 | About 12.4cm |
| 33 rhythmic gymnasts aged 5 to 102 | 7 days | ICC 0.88, error 4.3cm | 11.9cm |
The gymnastics paper works a case through in full: a child who jumps 100cm in the first test and 108cm in the second has not improved, because 8cm sits inside the error of the test.2 The preschool study is blunter still. The average difference between the two days was only 1.3cm, but the limits of agreement for an individual child ran from minus 33.3cm to plus 35.8cm.1 Squad averages are steady. Single scores are not.
On the tracker that means treating anything under about 12cm in a child as unchanged, and looking at the shape of the column over a season rather than the step between two dates. Adults are a different case, because the second attempt is usually longer than the first until a few sessions have been done, which is covered on the standing long jump norms page.
Best Jump or Average
Both are defensible. Best of three answers what an athlete can do, average of three answers what they do reliably, and the average is the steadier number because averaging cancels part of the random error. What matters is that the tracker compares like with like from one date to the next.
The number of attempts counts as part of the protocol too. A review of standing long jump data from 6,233,940 Chinese children and adolescents had to go back and collect raw data from another 22,346 participants purely to harmonise how many attempts each study allowed.3 If your squad takes three jumps in March and two in June, the June column is not comparable with the March one, whatever the spreadsheet says.
What the Trend Looks Like Elsewhere
The same review found that standing long jump performance in Chinese children and adolescents fell by 6.88cm per decade between 2000 and 2025, with a steeper decline in boys than in girls and a marked decline in high school students. The spread of scores also widened, with the ratio of coefficients of variation at 1.28.3
Two things follow for a squad tracker. A group average that simply holds steady across a season is running against the background trend, and the widening spread means the gap between your strongest and weakest athlete is likely to be wider than an old textbook table suggests.
Frequently Asked Questions
How much does a broad jump have to improve before it counts?
In young children, around 12cm. Two separate test-retest studies put the threshold at 12.4cm in preschoolers and 11.9cm in gymnasts aged 5 to 10, which means a gain of 8cm reads as normal variation rather than training.1,2 Older and more practised athletes are more consistent, so use your own squad data: the smallest gap you can trust is the one your repeat tests show.Should I record the best jump or the average?
Record all three trials and decide which one the tracker uses before the first testing day. Best of three is the common choice and matches most published norms. The average of three is more stable, because random error partly cancels. The mistake is switching between them mid season, which produces a change in the tracker that has nothing to do with the athlete.How many trials should each athlete take?
Three is the usual number, and the sheet is built for three. Fewer trials makes the best-of score less repeatable, more trials adds fatigue without adding much information. The important part is keeping the count the same at every test date, since a review of millions of test results had to be re-collected to harmonise exactly this.3Can I compare a tape measured jump with one from an electronic mat?
Not within the same tracker column. The measuring method is part of the protocol, so a change of method and a change in the athlete look identical in the numbers. If you move from a tape to a test mat mid season, start a new column and note the date, or retest everyone with both methods on the same day to see how far apart they sit for your setup.How often should a squad be retested?
Every six to eight weeks suits most seasons. Explosive power changes slowly, and with an error band of around 12cm in children, testing monthly mostly records noise. Test at the same point in the week, at the same time of day, with the same warm up, and before a hard session rather than after one, so the conditions are not doing the work.What belongs in the notes column?
Anything that would change how you read the number later. A slip on landing, a false start, a new surface, testing after a heavy session, an athlete carrying an injury, a different tester or a different measuring method all belong there. A number without that context is guesswork when you come back to it six months later, and the notes cost seconds to write.Related Reading
- Standing long jump norms by age, to read the numbers against a population.
- Make your own measuring mat, if you are testing without one.
- Electronic long jump test mat, which reads the distance for you.
- Free video analysis with Kinovea, for checking take off and landing technique.
References
- Soto-Sanchez J, Leyton-Dinamarca B, Kain J, et al. Reliability of the PREFIT fitness-test battery in Chilean preschoolers. Frontiers in Pediatrics. 2025. doi:10.3389/fped.2025.1654731
- Rashid Xamidovich K, Mehriddin Junaydulloyevich A, Nodir Nuriddinovich X, et al. Evaluation of adaptation based on biological variability and substantial changes in young rhythmic gymnasts. Frontiers in Sports and Active Living. 2026. doi:10.3389/fspor.2026.1860505
- Qin G, Tomkinson GR, Luo R, Li X, Zhang D, Liu Y. Temporal trends in standing long jump performance of 6,233,940 Chinese children and adolescents between 2000 and 2025. Journal of Exercise Science and Fitness. 2026. doi:10.1016/j.jesf.2026.200518
Dr Wannaporn Sumranpat Brady is a physiotherapist with a PhD, not a medical doctor, and a lecturer in the Department of Health Science and Sports at Mahasarakham University's Faculty of Education. Her research is on patellofemoral pain (PFP). She holds a PhD in Exercise and Sport Science from Mahasarakham University, an MSc in Physical Therapy from Khon Kaen University and a BSc in Physical Therapy from Naresuan University, and has also published on athletic injury rehabilitation, sports biomechanics and physical training programme design. She co-founded Isaan Sport Technology and writes its sports science articles, which take their figures from journal studies and from tests on the equipment the store sells.