A standing long jump is the cheapest useful test in sports science. It needs a line, a tape measure and a flat surface, and it tells you more about lower body power than anything else you can run in a school hall in ten minutes. This page collects published reference figures for adults, children and athletes, each one with the population it came from, because the same jump can look excellent or poor depending on which table you read it against.
How to Use It
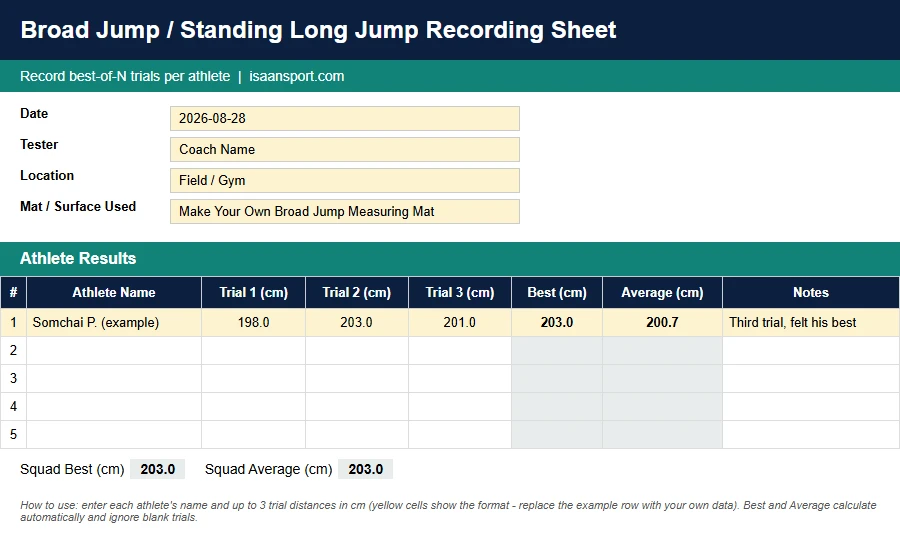
Measure the jump, then find the table that matches the person in front of you: the adult averages if they are an ordinary adult, the youth percentiles if they are at school, and the athlete tables if they play at a competitive level. We have a free recording spreadsheet for logging the results. Every figure on this page is taken from a peer reviewed paper, and each source is named under its table so you can check it.
Adult Norms (cm)
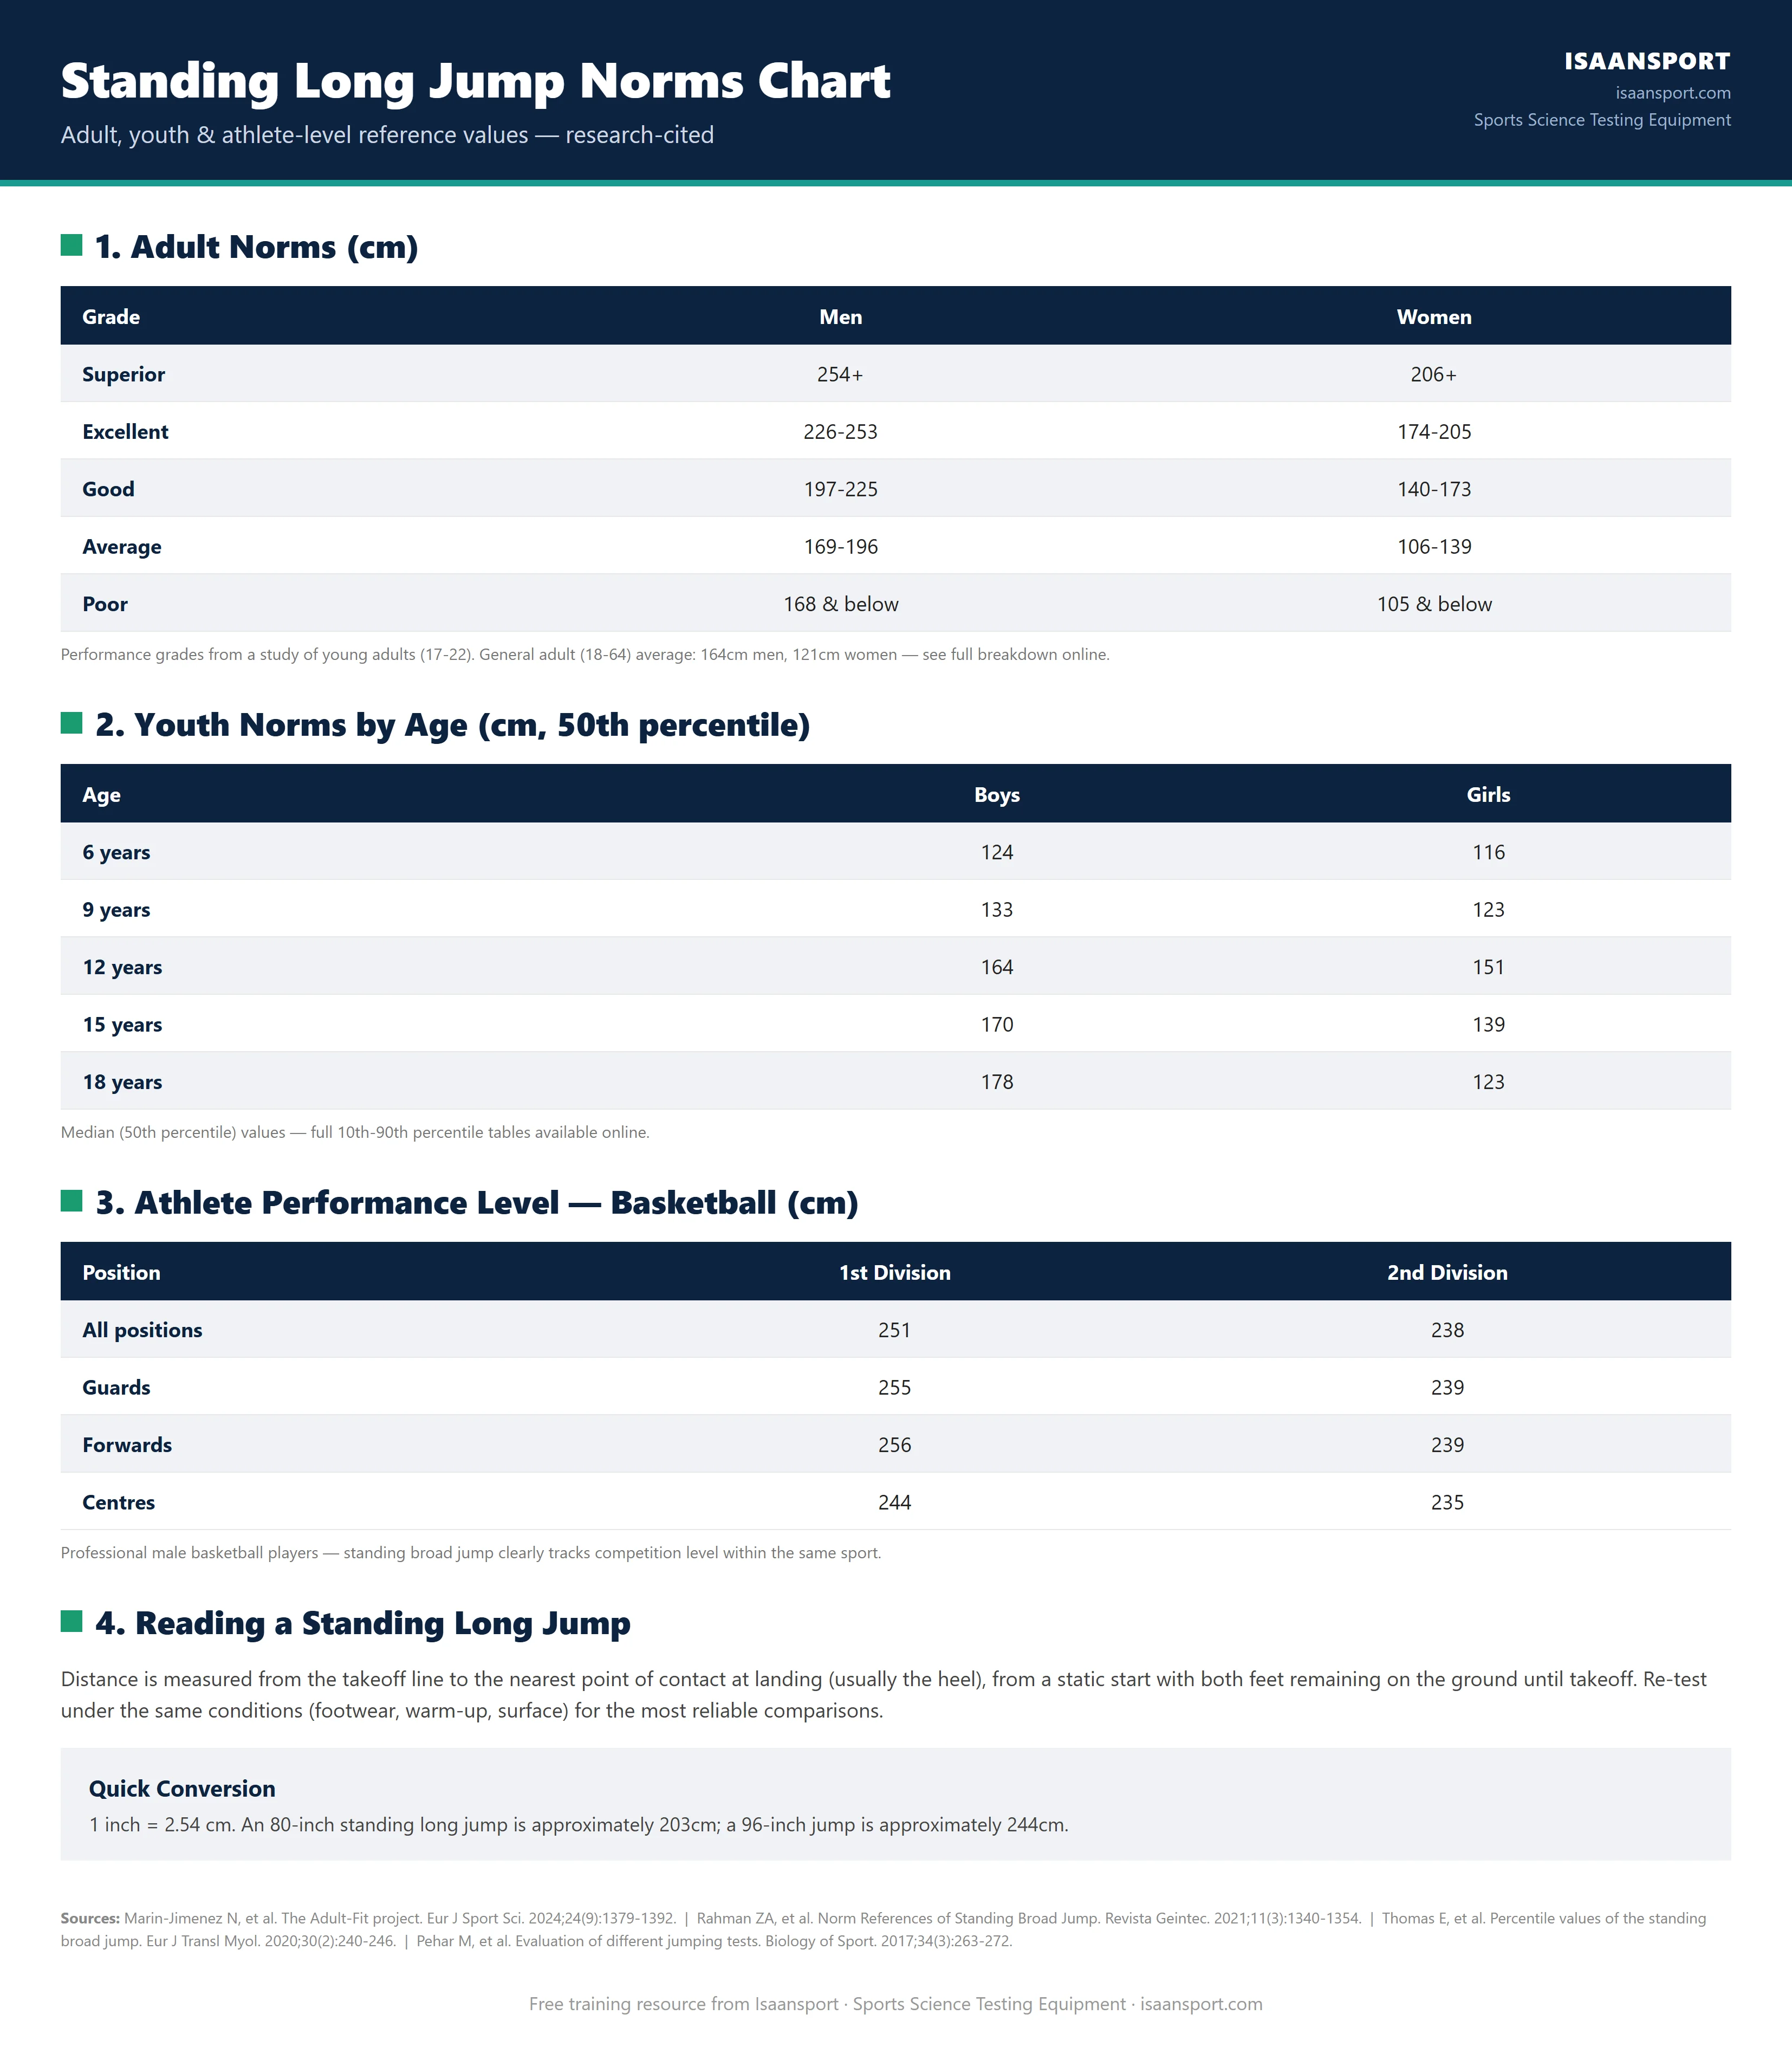
Average standing long jump distances by age and activity level, from a 2024 study of 410 Spanish adults aged 18 to 64, tested on a field based standing long jump alongside force platform and isokinetic measurements:
| Group | Average Distance (cm) |
|---|---|
| Men (all ages) | 164 |
| Women (all ages) | 121 |
| Age 18-34 | 160 |
| Age 35-49 | 146 |
| Age 50-64 | 121 |
| Physically active adults | 154 |
| Non-active adults | 131 |
Source: Marin-Jimenez N, Perez-Bey A, Cruz-Leon C, et al. Criterion-related validity and reliability of the standing long jump test in adults: The Adult-Fit project. European Journal of Sport Science. 2024;24(9):1379-1392. doi: 10.1002/ejsc.12182
Rating Bands for Active Young Adults (cm)
These grades come from 417 candidates sitting the fitness entrance test for a physical education degree in Malaysia, aged 19 to 22. The male average in that group was 211.5cm and the female average 156.0cm, well above the general adult figures in the table above, because everybody in it had chosen a physically demanding degree and was being tested for entry to it.
| Grade | Men | Women |
|---|---|---|
| Superior | 254+ cm | 206+ cm |
| Excellent | 226-253 cm | 174-205 cm |
| Good | 197-225 cm | 140-173 cm |
| Average | 169-196 cm | 106-139 cm |
| Poor | 168 cm and below | 105 cm and below |
Source: Rahman ZA, Kamal AA, Noor MAM, Geok SK, Alnedral. Reliability, Validity, and Norm References of Standing Broad Jump. Revista Geintec. 2021;11(3):1340-1354. Bands built by the standard deviation method from 207 men (mean 211.5cm) and 210 women (mean 156.0cm).
Read the two adult tables together rather than separately. An untrained 30 year old man who jumps 165cm is close to the published average for his age, and at the same time he lands in the bottom band of a scale built from physical education candidates. Neither result is wrong. The grade only means something against the group it was built from, which is the single most common mistake made with fitness norms.
Youth Norms by Age (cm)
10th, 50th and 90th percentile values from a 2020 study of 2,140 schoolchildren in Italy, Lithuania, Germany, Spain, Portugal, Croatia and Turkey:
| Age | Boys (10th / 50th / 90th) | Girls (10th / 50th / 90th) |
|---|---|---|
| 6 | 101 / 124 / 138 | 95 / 116 / 133 |
| 9 | 105 / 133 / 179 | 100 / 123 / 155 |
| 12 | 137 / 164 / 193 | 122 / 151 / 175 |
| 15 | 132 / 170 / 198 | 112 / 139 / 176 |
| 18 | 146 / 178 / 220 | 100 / 123 / 157 |
Source: Thomas E, Petrigna L, Tabacchi G, et al. Percentile values of the standing broad jump in children and adolescents aged 6-18 years old. European Journal of Translational Myology. 2020;30(2):240-246. doi: 10.4081/ejtm.2020.9050 (open access). The full tables give every decile for every age from 6 to 18.
The girls' row at 18 is lower than the row at 15, and that is what the data says rather than a misprint. The authors describe a plateau in girls from about 12 to 13 followed by a decline, while boys keep improving to about 16 or 17. For a coach it means a 16 year old girl whose jump has stopped moving is following the population pattern, so judge her against her own earlier results rather than against the boys in the same class.
Athlete Performance Level (Basketball Players, in cm)
A study of 110 professional male basketball players compared first division with second division, broken down by playing position:
| Position | 1st Division, mean (SD) | 2nd Division, mean (SD) |
|---|---|---|
| All positions | 251 (21) | 238 (20) |
| Guards | 255 (17) | 239 (20) |
| Forwards | 256 (21) | 239 (22) |
| Centres | 244 (25) | 235 (21) |
Source: Pehar M, Sekulic D, Sisic N, et al. Evaluation of different jumping tests in defining position-specific and performance-level differences in high level basketball players. Biology of Sport. 2017;34(3):263-272. doi: 10.5114/biolsport.2017.67122
First division players out-jumped second division players at every position, with the largest gaps among guards and forwards. That is a difference between groups measured at one point in time, so it does not prove that a longer jump earns promotion. What it does show is that the test separates standards inside one sport, which is exactly what you want from a screening test.
What One Jump Actually Measures
In the Spanish adult study, the jump distance was explained mostly by maximal horizontal power, sex, body fat percentage, maximal horizontal force and lean mass, which together accounted for 78% of the variation between people. So a tape measure on the floor gets you a usable read on lower body power without a force platform, as long as the test is run the same way each time.
The same paper found something that changes how you should test. On the first day, the second attempt averaged 12.1cm further than the first, and the smallest change that could be trusted as real was 29cm. After a learning period, the difference between attempts fell to under half a centimetre and the smallest trustworthy change fell to about 1cm. In other words, an untrained athlete gets better at the test itself before they get better at jumping, so give them practice jumps in a session that does not count, then start recording.
How to Run the Test
- Start behind a fixed line, feet about shoulder width apart, toes behind the line, both feet flat and staying on the ground until take off.
- Swing the arms and bend the knees, then jump forward and land on both feet. Arms are part of this test, unlike a hands on hips countermovement jump.
- Measure from the take off line to the nearest point of contact, which is usually the heel, but is the backside or a hand if the athlete falls backwards.
- Take three attempts and keep the best, after practice jumps that do not count.
- Keep the surface, footwear, warm up and time of day the same every time you retest, and write down what they were.
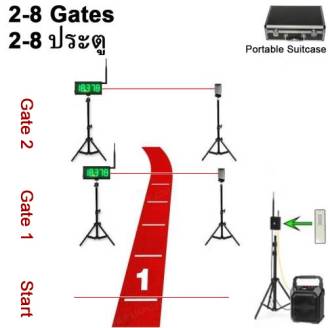
If you want to build the measuring surface yourself, we have a free template for making your own broad jump measuring mat. An electronic long jump mat does the same job without a tape: it is 3.6m long, two infrared bars sit across it on magnets at the positions that suit your athletes, and the display reads the heel of the rearmost foot in 5cm steps. Because a backwards fall changes the reading to the furthest back contact, record three attempts and take the best, which is the same protocol the studies above used.
For vertical power rather than horizontal, the jump testing range covers Vertec style testers, and for aerobic fitness there is our beep test and Yo-Yo test VO2max calculator. If the aim is to move the number rather than record it, the research on power cleans and plyometrics applies to horizontal jumping as well.
Common Questions
What is a good standing long jump?
It depends which group you are comparing against. Spanish adults aged 18 to 64 averaged 164cm for men and 121cm for women, and adults aged 18 to 34 averaged 160cm. Candidates for a physical education degree, aged 19 to 22 and selected for it, averaged 211cm for men and 156cm for women. Professional basketball players average about 240 to 255cm. Pick the table that matches the person you tested.
How far should a 12 year old jump?
Around 164cm for a boy and 151cm for a girl, which are the median figures from 2,140 European schoolchildren. The 10th percentile at that age is 137cm for boys and 122cm for girls, and the 90th percentile is 193cm and 175cm. A child below the 10th percentile is worth a second look for technique before anything else, because a poor landing or an early foot lift costs distance.
What is the average standing long jump for a 16 or 18 year old?
About 180cm for a 16 year old boy and 131cm for a 16 year old girl, the median figures from 2,140 European schoolchildren. At 18 the medians are 178cm for boys and 123cm for girls, and the 90th percentile is 220cm and 157cm. Boys usually keep improving to about 16 or 17 while girls level off from about 12 or 13, so compare a teenager with their own earlier results as well as with the table.
Is the standing long jump the same as the broad jump?
Yes, they are two names for one test, along with standing broad jump and SBJ in the research. All of them mean a two footed jump for distance from a standing start. The long jump in athletics is a different event entirely, because it uses a run up, so do not compare a standing result with an athletics long jump distance or with figures quoted for one.
How much can my result change before it means something?
About 29cm on a first testing day, which is a lot. That figure is the smallest change that can be trusted in untrained adults who have not practised the test, and it falls to roughly 1cm once they have. Almost all of that early improvement is learning the movement rather than gaining power, so run a practice session first and only then start recording results that you plan to compare.
Can I use a tape measure instead of a mat?
Yes, and every study on this page used a field test rather than a laboratory. A tape and a fixed take off line are enough, provided somebody marks the nearest point of contact accurately while the athlete is still standing in it. A mat removes the marking step and the argument that goes with it, which matters most when you are testing a whole squad and want the session to move.
Does the standing long jump predict sprint speed?
It measures the same quality that acceleration draws on, which is horizontal power. In the Spanish study, horizontal power, force and lean mass explained most of the difference between people, and in professional basketball the test separated first division players from second division players. It is a screening test rather than a substitute for timing a sprint, so use it to find who needs work, then time the runs.
Dr Wannaporn Sumranpat Brady is a physiotherapist with a PhD, not a medical doctor, and a lecturer in the Department of Health Science and Sports at Mahasarakham University's Faculty of Education. Her research is on patellofemoral pain (PFP). She holds a PhD in Exercise and Sport Science from Mahasarakham University, an MSc in Physical Therapy from Khon Kaen University and a BSc in Physical Therapy from Naresuan University, and has also published on athletic injury rehabilitation, sports biomechanics and physical training programme design. She co-founded Isaan Sport Technology and writes its sports science articles, which take their figures from journal studies and from tests on the equipment the store sells.