การกระโดดไกลแบบยืนเป็นการทดสอบที่ประหยัดที่สุดในบรรดาการทดสอบทางวิทยาศาสตร์การกีฬา ใช้เพียงเส้นเริ่ม สายวัด และพื้นเรียบ แต่บอกเรื่องพลังของช่วงล่างได้มากกว่าการทดสอบอื่นที่ทำได้ในโรงยิมโรงเรียนภายในสิบนาที หน้านี้รวบรวมค่าอ้างอิงที่ตีพิมพ์แล้วสำหรับผู้ใหญ่ เด็กนักเรียน และนักกีฬา พร้อมระบุกลุ่มประชากรของแต่ละตาราง เพราะการกระโดดครั้งเดียวกันอาจดูดีเยี่ยมหรือดูต่ำ ขึ้นอยู่กับว่าเทียบกับตารางไหน
วิธีใช้งาน
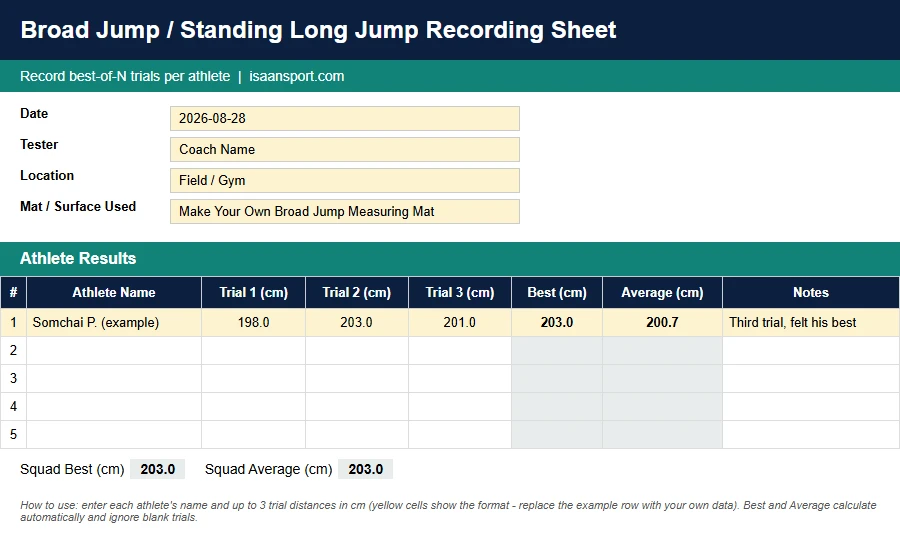
วัดระยะกระโดด แล้วเลือกตารางที่ตรงกับคนที่อยู่ตรงหน้า ได้แก่ ตารางค่าเฉลี่ยผู้ใหญ่สำหรับคนทั่วไป ตารางเปอร์เซ็นไทล์เยาวชนสำหรับเด็กวัยเรียน และตารางนักกีฬาสำหรับผู้ที่แข่งขันในระดับจริงจัง เรามีชีตบันทึกผลฟรีสำหรับเก็บข้อมูล ตัวเลขทุกตัวในหน้านี้มาจากงานวิจัยที่ผ่านการตรวจสอบโดยผู้เชี่ยวชาญ และระบุแหล่งที่มาไว้ใต้ตารางแต่ละตารางให้ตรวจสอบได้
เกณฑ์มาตรฐานผู้ใหญ่ (ซม.)
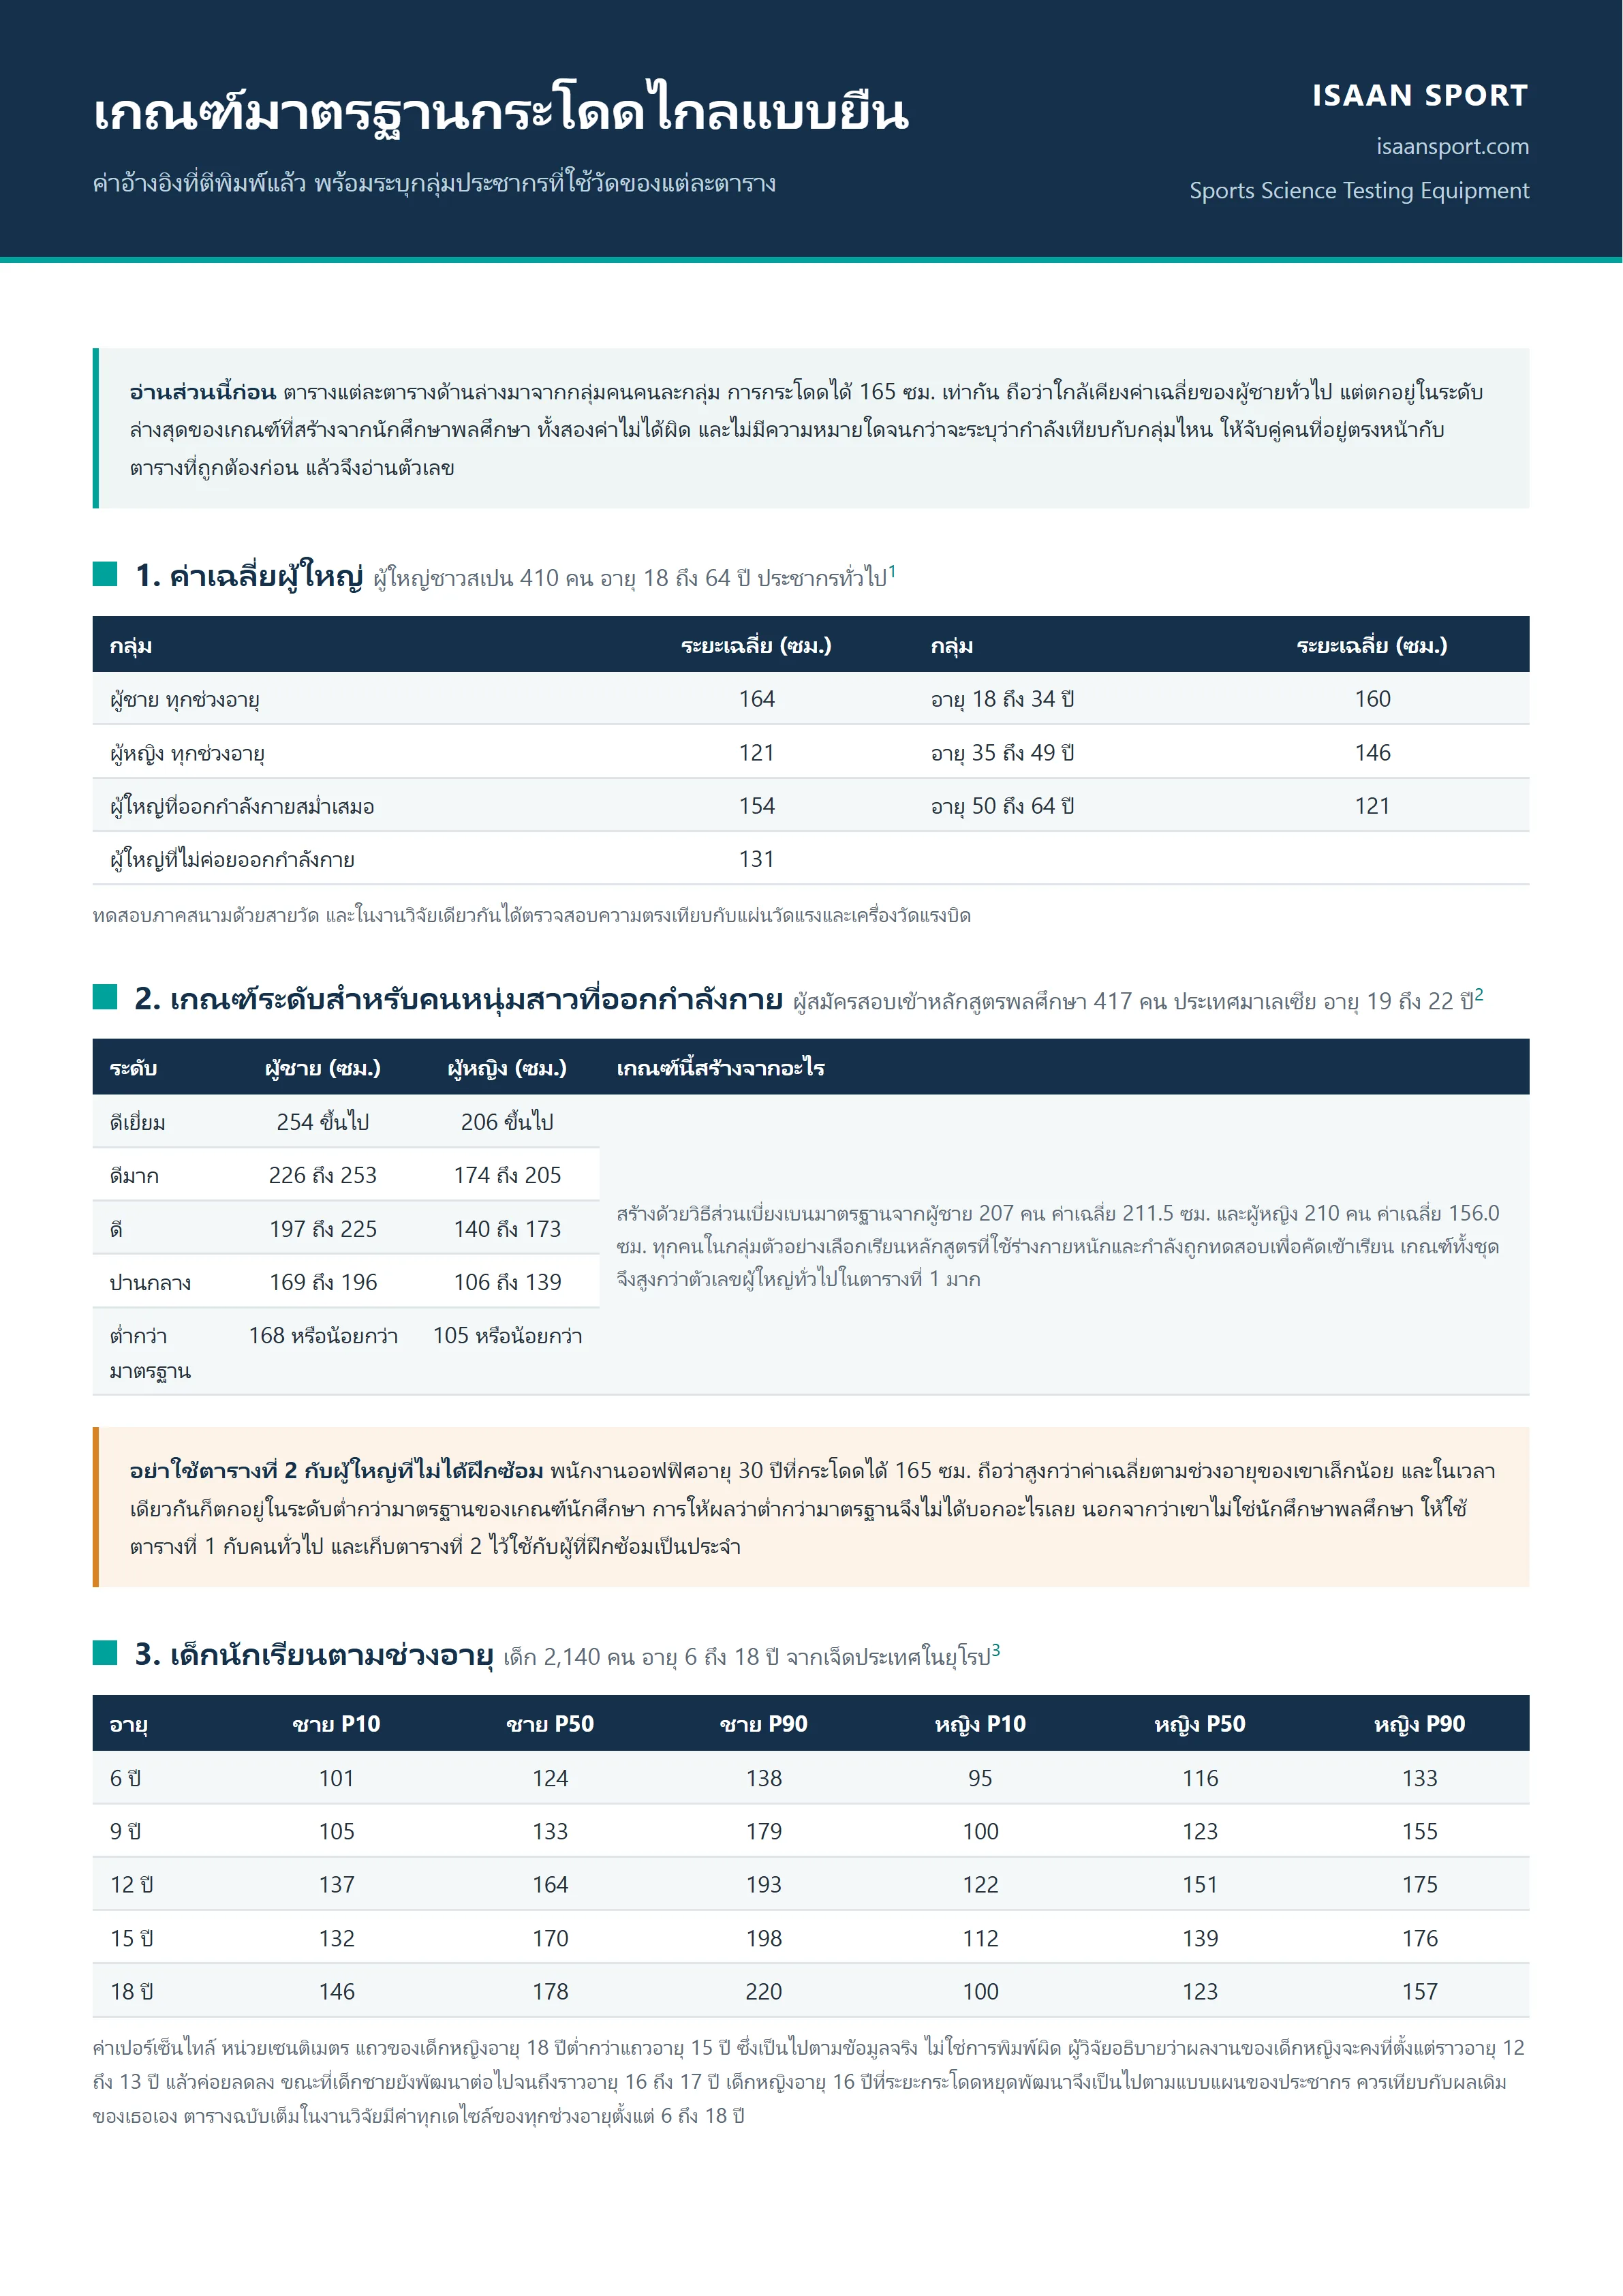
ระยะกระโดดไกลเฉลี่ยแยกตามช่วงอายุและระดับกิจกรรม จากงานวิจัยปี 2024 ในผู้ใหญ่ชาวสเปน 410 คน อายุ 18 ถึง 64 ปี ซึ่งทดสอบภาคสนามควบคู่กับการวัดด้วยแผ่นวัดแรงและเครื่องวัดแรงบิด:
| กลุ่ม | ระยะเฉลี่ย (ซม.) |
|---|---|
| ผู้ชาย (ทุกช่วงอายุ) | 164 |
| ผู้หญิง (ทุกช่วงอายุ) | 121 |
| อายุ 18-34 ปี | 160 |
| อายุ 35-49 ปี | 146 |
| อายุ 50-64 ปี | 121 |
| ผู้ใหญ่ที่ออกกำลังกายสม่ำเสมอ | 154 |
| ผู้ใหญ่ที่ไม่ค่อยออกกำลังกาย | 131 |
แหล่งข้อมูล: Marin-Jimenez N, Perez-Bey A, Cruz-Leon C, et al. Criterion-related validity and reliability of the standing long jump test in adults: The Adult-Fit project. European Journal of Sport Science. 2024;24(9):1379-1392. doi: 10.1002/ejsc.12182
เกณฑ์ระดับสำหรับคนหนุ่มสาวที่ออกกำลังกาย (ซม.)
เกณฑ์ชุดนี้มาจากผู้สมัคร 417 คนที่เข้าทดสอบสมรรถภาพเพื่อเข้าเรียนหลักสูตรพลศึกษาในประเทศมาเลเซีย อายุ 19 ถึง 22 ปี ค่าเฉลี่ยของผู้ชายในกลุ่มนี้อยู่ที่ 211.5 ซม. และผู้หญิง 156.0 ซม. ซึ่งสูงกว่าตัวเลขผู้ใหญ่ทั่วไปในตารางด้านบนมาก เพราะทุกคนในกลุ่มเลือกเรียนหลักสูตรที่ใช้ร่างกายหนักและกำลังถูกทดสอบเพื่อคัดเข้าเรียน
| ระดับ | ผู้ชาย | ผู้หญิง |
|---|---|---|
| ดีเยี่ยม | 254+ ซม. | 206+ ซม. |
| ดีมาก | 226-253 ซม. | 174-205 ซม. |
| ดี | 197-225 ซม. | 140-173 ซม. |
| ปานกลาง | 169-196 ซม. | 106-139 ซม. |
| ต่ำกว่ามาตรฐาน | 168 ซม. หรือน้อยกว่า | 105 ซม. หรือน้อยกว่า |
แหล่งข้อมูล: Rahman ZA, Kamal AA, Noor MAM, Geok SK, Alnedral. Reliability, Validity, and Norm References of Standing Broad Jump. Revista Geintec. 2021;11(3):1340-1354. เกณฑ์สร้างด้วยวิธีส่วนเบี่ยงเบนมาตรฐานจากผู้ชาย 207 คน (ค่าเฉลี่ย 211.5 ซม.) และผู้หญิง 210 คน (ค่าเฉลี่ย 156.0 ซม.)
ควรอ่านสองตารางนี้ควบคู่กัน ผู้ชายอายุ 30 ปีที่ไม่ได้ฝึกซ้อมและกระโดดได้ 165 ซม. ถือว่าใกล้เคียงค่าเฉลี่ยตามช่วงอายุของเขา แต่ในขณะเดียวกันก็ตกอยู่ในระดับล่างสุดของเกณฑ์ที่สร้างจากผู้สมัครเรียนพลศึกษา ผลทั้งสองไม่ได้ผิด เพราะระดับจะมีความหมายก็ต่อเมื่อเทียบกับกลุ่มที่ใช้สร้างเกณฑ์นั้น ซึ่งเป็นความเข้าใจผิดที่พบบ่อยที่สุดในการใช้เกณฑ์มาตรฐานสมรรถภาพ
เกณฑ์มาตรฐานเยาวชนตามช่วงอายุ (ซม.)
ค่าเปอร์เซ็นไทล์ที่ 10 / 50 / 90 จากงานวิจัยปี 2020 ในเด็กนักเรียน 2,140 คน จากอิตาลี ลิทัวเนีย เยอรมนี สเปน โปรตุเกส โครเอเชีย และตุรกี:
| อายุ | เด็กชาย (10 / 50 / 90) | เด็กหญิง (10 / 50 / 90) |
|---|---|---|
| 6 ปี | 101 / 124 / 138 | 95 / 116 / 133 |
| 9 ปี | 105 / 133 / 179 | 100 / 123 / 155 |
| 12 ปี | 137 / 164 / 193 | 122 / 151 / 175 |
| 15 ปี | 132 / 170 / 198 | 112 / 139 / 176 |
| 18 ปี | 146 / 178 / 220 | 100 / 123 / 157 |
แหล่งข้อมูล: Thomas E, Petrigna L, Tabacchi G, et al. Percentile values of the standing broad jump in children and adolescents aged 6-18 years old. European Journal of Translational Myology. 2020;30(2):240-246. doi: 10.4081/ejtm.2020.9050 (เผยแพร่แบบเปิด) ตารางฉบับเต็มมีค่าทุกเดไซล์ของทุกช่วงอายุตั้งแต่ 6 ถึง 18 ปี
แถวของเด็กหญิงอายุ 18 ปีต่ำกว่าแถวอายุ 15 ปี ซึ่งเป็นไปตามข้อมูลจริง ไม่ใช่การพิมพ์ผิด ผู้วิจัยอธิบายว่าผลงานของเด็กหญิงจะคงที่ตั้งแต่ราวอายุ 12 ถึง 13 ปี แล้วค่อยลดลง ขณะที่เด็กชายยังพัฒนาต่อไปจนถึงราวอายุ 16 ถึง 17 ปี สำหรับโค้ชหมายความว่า เด็กหญิงอายุ 16 ปีที่ระยะกระโดดหยุดพัฒนาถือว่าเป็นไปตามแบบแผนของประชากร จึงควรเทียบกับผลเดิมของเธอเอง มากกว่าเทียบกับเด็กชายในห้องเดียวกัน
ระดับนักกีฬา (นักบาสเกตบอล, หน่วยเซนติเมตร)
งานวิจัยในนักบาสเกตบอลอาชีพชาย 110 คน เปรียบเทียบผู้เล่นดิวิชั่น 1 กับดิวิชั่น 2 แยกตามตำแหน่งที่เล่น:
| ตำแหน่ง | ดิวิชั่น 1 ค่าเฉลี่ย (SD) | ดิวิชั่น 2 ค่าเฉลี่ย (SD) |
|---|---|---|
| ทุกตำแหน่ง | 251 (21) | 238 (20) |
| การ์ด | 255 (17) | 239 (20) |
| ฟอร์เวิร์ด | 256 (21) | 239 (22) |
| เซ็นเตอร์ | 244 (25) | 235 (21) |
แหล่งข้อมูล: Pehar M, Sekulic D, Sisic N, et al. Evaluation of different jumping tests in defining position-specific and performance-level differences in high level basketball players. Biology of Sport. 2017;34(3):263-272. doi: 10.5114/biolsport.2017.67122
ผู้เล่นดิวิชั่น 1 กระโดดได้ไกลกว่าผู้เล่นดิวิชั่น 2 ในทุกตำแหน่ง โดยการ์ดและฟอร์เวิร์ดมีช่องว่างมากที่สุด นี่คือความแตกต่างระหว่างกลุ่มที่วัด ณ ช่วงเวลาหนึ่ง จึงไม่ได้พิสูจน์ว่าการกระโดดได้ไกลขึ้นจะทำให้เลื่อนชั้นได้ แต่แสดงว่าการทดสอบนี้แยกระดับภายในกีฬาชนิดเดียวกันได้ ซึ่งเป็นสิ่งที่ต้องการจากการทดสอบคัดกรอง
การกระโดดหนึ่งครั้งวัดอะไรได้จริง
ในงานวิจัยผู้ใหญ่ชาวสเปน ระยะกระโดดอธิบายได้ด้วยพลังในแนวราบสูงสุด เพศ เปอร์เซ็นต์ไขมันในร่างกาย แรงในแนวราบสูงสุด และมวลกล้ามเนื้อ ซึ่งรวมกันอธิบายความแตกต่างระหว่างบุคคลได้ถึง 78% สายวัดบนพื้นจึงให้ข้อมูลพลังของช่วงล่างที่ใช้ได้จริงโดยไม่ต้องมีแผ่นวัดแรง ตราบใดที่ทดสอบด้วยวิธีเดียวกันทุกครั้ง
งานวิจัยเดียวกันยังพบสิ่งที่เปลี่ยนวิธีทดสอบ ในวันแรก การกระโดดครั้งที่สองไกลกว่าครั้งแรกโดยเฉลี่ย 12.1 ซม. และการเปลี่ยนแปลงที่เล็กที่สุดที่เชื่อถือได้ว่าเป็นของจริงอยู่ที่ 29 ซม. หลังจากมีช่วงเรียนรู้ ความต่างระหว่างครั้งลดลงเหลือไม่ถึงครึ่งเซนติเมตร และการเปลี่ยนแปลงที่เชื่อถือได้ลดลงเหลือราว 1 ซม. พูดง่ายๆ คือ ผู้ที่ไม่เคยฝึกจะเก่งขึ้นในการทดสอบก่อนที่จะกระโดดได้ไกลขึ้นจริง จึงควรให้กระโดดซ้อมในรอบที่ไม่นับผลก่อน แล้วจึงเริ่มบันทึก
วิธีทดสอบ
- เริ่มหลังเส้นที่กำหนด วางเท้าห่างประมาณความกว้างไหล่ ปลายเท้าอยู่หลังเส้น เท้าทั้งสองราบกับพื้นและอยู่กับพื้นจนถึงจังหวะกระโดด
- เหวี่ยงแขนและย่อเข่า แล้วกระโดดไปข้างหน้าและลงพื้นด้วยเท้าทั้งสองข้าง การทดสอบนี้ใช้แขนช่วยได้ ต่างจากการกระโดดแนวตั้งแบบเท้าสะเอว
- วัดจากเส้นเริ่มถึงจุดสัมผัสพื้นที่ใกล้เส้นที่สุด ซึ่งปกติคือส้นเท้า แต่เป็นสะโพกหรือมือหากผู้ทดสอบล้มไปด้านหลัง
- กระโดดสามครั้งแล้วเก็บผลที่ดีที่สุด หลังจากกระโดดซ้อมในรอบที่ไม่นับผล
- รักษาพื้นผิว รองเท้า การวอร์มอัพ และช่วงเวลาของวันให้เหมือนเดิม ทุกครั้งที่ทดสอบซ้ำ และจดบันทึกไว้ว่าใช้อะไรบ้าง
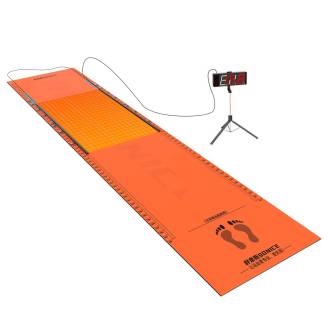
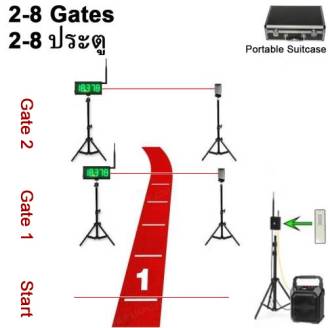
หากต้องการทำพื้นที่วัดเอง เรามีแบบฟรีสำหรับทำแผ่นวัดการกระโดดไกลด้วยตัวเอง ส่วนแผ่นวัดการกระโดดไกลแบบอิเล็กทรอนิกส์ทำงานเดียวกันโดยไม่ต้องใช้สายวัด ตัวแผ่นยาว 3.6 เมตร มีแถบอินฟราเรดสองแถบวางขวางบนแม่เหล็กในตำแหน่งที่เหมาะกับนักกีฬาของคุณ และจอแสดงผลอ่านที่ส้นเท้าหลังสุดโดยอ่านค่าละเอียดทีละ 5 เซนติเมตร เนื่องจากการล้มไปด้านหลังจะทำให้ค่าเปลี่ยนเป็นจุดสัมผัสที่ถอยหลังไปไกลที่สุด จึงควรบันทึกสามครั้งแล้วเลือกครั้งที่ดีที่สุด ซึ่งเป็นวิธีเดียวกับที่งานวิจัยข้างต้นใช้
หากต้องการวัดพลังในแนวตั้งแทนแนวราบ ดูกลุ่มสินค้าทดสอบการกระโดด ซึ่งมีเครื่องทดสอบแบบ Vertec และหากต้องการวัดสมรรถภาพแอโรบิก ดูเครื่องคำนวณ VO2max จากบีพเทสต์และ Yo-Yo Test ส่วนผู้ที่ต้องการเพิ่มตัวเลขมากกว่าบันทึกตัวเลข งานวิจัยเรื่องพาวเวอร์คลีนและพลัยโอเมตริกใช้ได้กับการกระโดดในแนวราบเช่นกัน
คำถามที่พบบ่อย
ระยะกระโดดไกลแบบยืนที่ดีคือเท่าไร
ขึ้นอยู่กับว่าเทียบกับกลุ่มใด ผู้ใหญ่ชาวสเปนอายุ 18 ถึง 64 ปี มีค่าเฉลี่ย 164 ซม. ในผู้ชายและ 121 ซม. ในผู้หญิง ส่วนช่วงอายุ 18 ถึง 34 ปี เฉลี่ย 160 ซม. ผู้สมัครเรียนหลักสูตรพลศึกษาอายุ 19 ถึง 22 ปี ซึ่งผ่านการคัดเลือก เฉลี่ย 211 ซม. ในผู้ชายและ 156 ซม. ในผู้หญิง ขณะที่นักบาสเกตบอลอาชีพเฉลี่ยราว 240 ถึง 255 ซม. จึงควรเลือกตารางที่ตรงกับคนที่คุณทดสอบ
เด็กอายุ 12 ปีควรกระโดดได้ไกลเท่าไร
ราว 164 ซม. สำหรับเด็กชายและ 151 ซม. สำหรับเด็กหญิง ซึ่งเป็นค่ามัธยฐานจากเด็กนักเรียนยุโรป 2,140 คน ที่อายุนี้เปอร์เซ็นไทล์ที่ 10 อยู่ที่ 137 ซม. ในเด็กชายและ 122 ซม. ในเด็กหญิง ส่วนเปอร์เซ็นไทล์ที่ 90 อยู่ที่ 193 และ 175 ซม. เด็กที่ต่ำกว่าเปอร์เซ็นไทล์ที่ 10 ควรตรวจดูเทคนิคก่อนเรื่องอื่น เพราะการลงพื้นที่ไม่ดีหรือการยกเท้าเร็วเกินไปทำให้เสียระยะ
ระยะกระโดดไกลแบบยืนเฉลี่ยของเด็กอายุ 16 หรือ 18 ปีคือเท่าไร
ราว 180 ซม. สำหรับเด็กชายอายุ 16 ปี และ 131 ซม. สำหรับเด็กหญิงอายุ 16 ปี ซึ่งเป็นค่ามัธยฐานจากเด็กนักเรียนยุโรป 2,140 คน ที่อายุ 18 ปี ค่ามัธยฐานอยู่ที่ 178 ซม. ในเด็กชายและ 123 ซม. ในเด็กหญิง ส่วนเปอร์เซ็นไทล์ที่ 90 อยู่ที่ 220 และ 157 ซม. เด็กชายมักพัฒนาต่อไปจนถึงราว 16 ถึง 17 ปี ขณะที่เด็กหญิงคงที่ตั้งแต่ราว 12 ถึง 13 ปี จึงควรเทียบผลของวัยรุ่นกับผลครั้งก่อนของตัวเองควบคู่กับตาราง
กระโดดไกลแบบยืนกับ broad jump คือการทดสอบเดียวกันหรือไม่
ใช่ เป็นชื่อเรียกของการทดสอบเดียวกัน รวมถึงชื่อ standing broad jump และ SBJ ในงานวิจัย ทั้งหมดหมายถึงการกระโดดด้วยสองเท้าเพื่อวัดระยะจากท่ายืนนิ่ง ส่วนกระโดดไกลในกรีฑาเป็นคนละประเภท เพราะมีการวิ่งนำก่อนกระโดด จึงไม่ควรนำผลแบบยืนไปเทียบกับระยะกระโดดไกลในกรีฑาหรือกับตัวเลขที่อ้างถึงประเภทนั้น
ผลจะมีความหมายได้ ต้องเปลี่ยนไปมากแค่ไหน
ราว 29 ซม. ในวันทดสอบวันแรก ซึ่งถือว่ามาก ตัวเลขนี้คือการเปลี่ยนแปลงที่เล็กที่สุดที่เชื่อถือได้ในผู้ใหญ่ที่ไม่ได้ฝึกและยังไม่เคยซ้อมการทดสอบนี้ และจะลดลงเหลือราว 1 ซม. เมื่อผ่านการซ้อมแล้ว พัฒนาการช่วงแรกเกือบทั้งหมดมาจากการเรียนรู้ท่าทาง ไม่ใช่พลังที่เพิ่มขึ้น จึงควรจัดรอบซ้อมก่อน แล้วจึงเริ่มบันทึกผลที่ตั้งใจจะนำไปเปรียบเทียบ
ใช้สายวัดแทนแผ่นวัดได้หรือไม่
ได้ และงานวิจัยทุกชิ้นในหน้านี้ก็ใช้การทดสอบภาคสนามไม่ใช่ห้องปฏิบัติการ สายวัดกับเส้นเริ่มที่ตายตัวก็เพียงพอ ตราบใดที่มีคนทำเครื่องหมายจุดสัมผัสที่ใกล้เส้นที่สุดอย่างแม่นยำขณะที่ผู้ทดสอบยังยืนอยู่ตรงนั้น แผ่นวัดช่วยตัดขั้นตอนการทำเครื่องหมายและข้อถกเถียงที่ตามมา ซึ่งสำคัญที่สุดเมื่อต้องทดสอบทั้งทีมและอยากให้การทดสอบเดินหน้าเร็ว
การกระโดดไกลแบบยืนทำนายความเร็วในการวิ่งได้หรือไม่
วัดคุณสมบัติเดียวกับที่การเร่งความเร็วใช้ นั่นคือพลังในแนวราบ ในงานวิจัยชาวสเปน พลังในแนวราบ แรง และมวลกล้ามเนื้ออธิบายความแตกต่างระหว่างบุคคลได้เป็นส่วนใหญ่ และในบาสเกตบอลอาชีพ การทดสอบนี้แยกผู้เล่นดิวิชั่น 1 ออกจากดิวิชั่น 2 ได้ จึงเหมาะเป็นการทดสอบคัดกรองมากกว่าจะใช้แทนการจับเวลาวิ่ง ควรใช้หาว่าใครต้องพัฒนา แล้วจึงจับเวลาจริง
ดร.วรรณพร สำราญพัฒน์ เบรดี เป็นนักกายภาพบำบัดที่จบปริญญาเอก ไม่ใช่แพทย์ และเป็นอาจารย์ประจำภาควิชาวิทยาศาสตร์สุขภาพและการกีฬา คณะศึกษาศาสตร์ มหาวิทยาลัยมหาสารคาม งานวิจัยหลักคือเรื่องอาการปวดข้อสะบ้า (patellofemoral pain, PFP) จบปริญญาเอกสาขาวิทยาศาสตร์การออกกำลังกายและการกีฬาจากมหาวิทยาลัยมหาสารคาม ปริญญาโทสาขากายภาพบำบัดจากมหาวิทยาลัยขอนแก่น และปริญญาตรีสาขากายภาพบำบัดจากมหาวิทยาลัยนเรศวร และมีผลงานวิจัยตีพิมพ์ด้านการฟื้นฟูการบาดเจ็บจากกีฬา ชีวกลศาสตร์การกีฬา และการออกแบบโปรแกรมฝึกร่างกายด้วย เป็นผู้ร่วมก่อตั้ง Isaan Sport Technology และเขียนบทความวิทยาศาสตร์การกีฬาของร้าน ซึ่งใช้ตัวเลขจากงานวิจัยในวารสารและจากการทดสอบอุปกรณ์ที่ร้านจำหน่าย